

Editorial NoteThis report was commissioned by GOAL 3 and produced by Rethink Priorities from August to September 2026. We lightly edited the report for publication. GOAL 3 does not necessarily endorse our conclusions. The report evaluates GOAL 3’s existing evidence base for the IMPALA system, a neonatal and pediatric monitoring tool designed for use in low-resource settings. We (i) assessed the strengths and weaknesses of its existing evidence base and (ii) constructed two models to estimate IMPALA’s potential cost-effectiveness for implementation in pediatric and neonatal wards in the African region, based on cost and impact data from GOAL 3 and our own subjective adjustments. We used different cost-effectiveness perspectives to inform our conclusions (i.e., a traditional global health estimate of cost per disability-adjusted life-year [DALY] averted, alongside estimates of return on investment calculated from the viewpoint of two effective altruism organizations). We have tried to flag major sources of uncertainty throughout, and we remain open to revising our views in light of new evidence or further research. We have no conflicts of interest to declare. |
Executive Summary
What We Did
- We assessed the evidence base of GOAL 3’s IMPALA system (GOAL 3, 2023), a continuous vital-signs monitoring system built for pediatric and neonatal wards in low-resource settings.
- We modeled the cost-effectiveness of introducing IMPALA in both pediatric wards and in neonatal intensive care units, using a deliberately conservative approach and three different funder viewpoints (a traditional global health perspective and funding bars from two effective altruism organizations) to arrive at realistic estimates.
Our Take on IMPALA’s Evidence Base
- Evidence points consistently toward a mortality benefit, but does not definitively establish one. Favorable estimates largely recur across Malawi, Rwanda, and Tanzania—a consistency harder to explain by chance than any single result—but the entire base is non-randomized and only partly controlled, mostly resting on before-after comparisons, and several individual estimates are statistically compatible with no effect.
- The magnitude of the true effect size remains unclear. The largest pediatric results (40–50%) depend heavily on assumed spillover[1] to children never actually monitored. In addition, the strongest research design of neonatal implementation coincided with major background shocks in Malawi that its structure likely cannot fully separate from a real effect, and unusually large effects of this kind typically shrink with more data.
- External evidence is also directionally supportive. Literature on continuous monitoring and triage scoring (almost entirely from high-income countries [HICs] and with mixed conclusions) generally supports the principle that more monitoring improves outcomes, and the poor low- and middle-income country (LMIC) counterfactual lowers the bar for a real effect.
Cost-Effectiveness
- IMPALA appears highly cost-effective under conservative assumptions and every funder perspective we applied: for pediatric wards, $7–$17/disability-adjusted life-year (DALY) averted, ~11,700x social return on investment (SROI), against Coefficient Giving (CG)’s 1,000x bar, and 76x cash transfers, against GiveWell (GW)’s 6x bar; for neonatal wards, $12–$30/DALY averted, SROI ~4,400x (CG) and 28x cash transfers (GW). These are highly cost-effective estimates even after substantial discounts to mortality effect sizes, and do not include other potential effects (e.g., morbidity or cost savings).
- Our assessment of cost-effectiveness is robust because it is driven by low cost, not by a large assumed effect. The break-even effect size is a mortality reduction of ~1% (pediatric) and ~2% (neonatal), well below our heavily discounted estimates, so the conclusion still stands even if there is substantial error in the true mortality reduction.
- Pediatric implementation is more cost-effective than neonatal implementation. This is driven by more intense monitoring needs for neonates, a lower baseline effect size, and (in some cases) a lower subjective valuation of preventing a newborn’s death.
Bottom Line
On present evidence, IMPALA is very likely a cost-effective use of funds in low-resource LMIC pediatric and neonatal wards. The case rests on a directionally consistent but individually weak mortality signal rather than a rigorously established effect size, but our modeling shows that IMPALA could be cost-effective with even a very small mortality effect.
Introduction
We were commissioned by GOAL 3, a hybrid social enterprise and foundation focused on bringing better patient monitoring to health workers operating in low-resource settings, to provide an external cost-effectiveness evaluation of its product: the IMPALA continuous monitoring system. IMPALA is comprised of three elements, which all work together with the intention of improving neonatal and pediatric outcomes:
- Patient monitor: A multiparameter monitor designed for use in low-resource settings (specifically, a 10-hour battery life and resistant to dust, heat, and insects), with specialized sensors to monitor vital signs.[2] Data is also linked to an integrated Pediatric Early Warning Score (PEWS).
- Centralized platform: A patient overview that allows healthcare providers to view the status of up to 50 patients simultaneously, as well as patient history and aggregated data across the ward.
- Subscription service package: Continuous technical and personnel support, plus optional additional features like supportive supervision (e.g., refresher training courses) and a monitoring, evaluation, and learning platform to support data review and program evaluation.
GOAL 3 has implemented the IMPALA system in both pediatric ward high-dependency units (HDUs) and neonatal intensive care units (NICUs), generating early estimates of health and economic impact in hospitals in Malawi, Tanzania, and Rwanda. In this report, we seek to answer the following questions from an external perspective:
- How strong is GOAL 3’s evidence base, and what are reasonable effect sizes for potential pediatric and neonatal ward implementations?
- How cost-effective is the IMPALA system for preventing pediatric or neonatal mortality in a generalized low- or middle-income country (LMIC) setting, from the viewpoint of a traditional global health assessment as well as organizations aligned with effective altruism (EA)?
Evidence Evaluation
Theory of Change
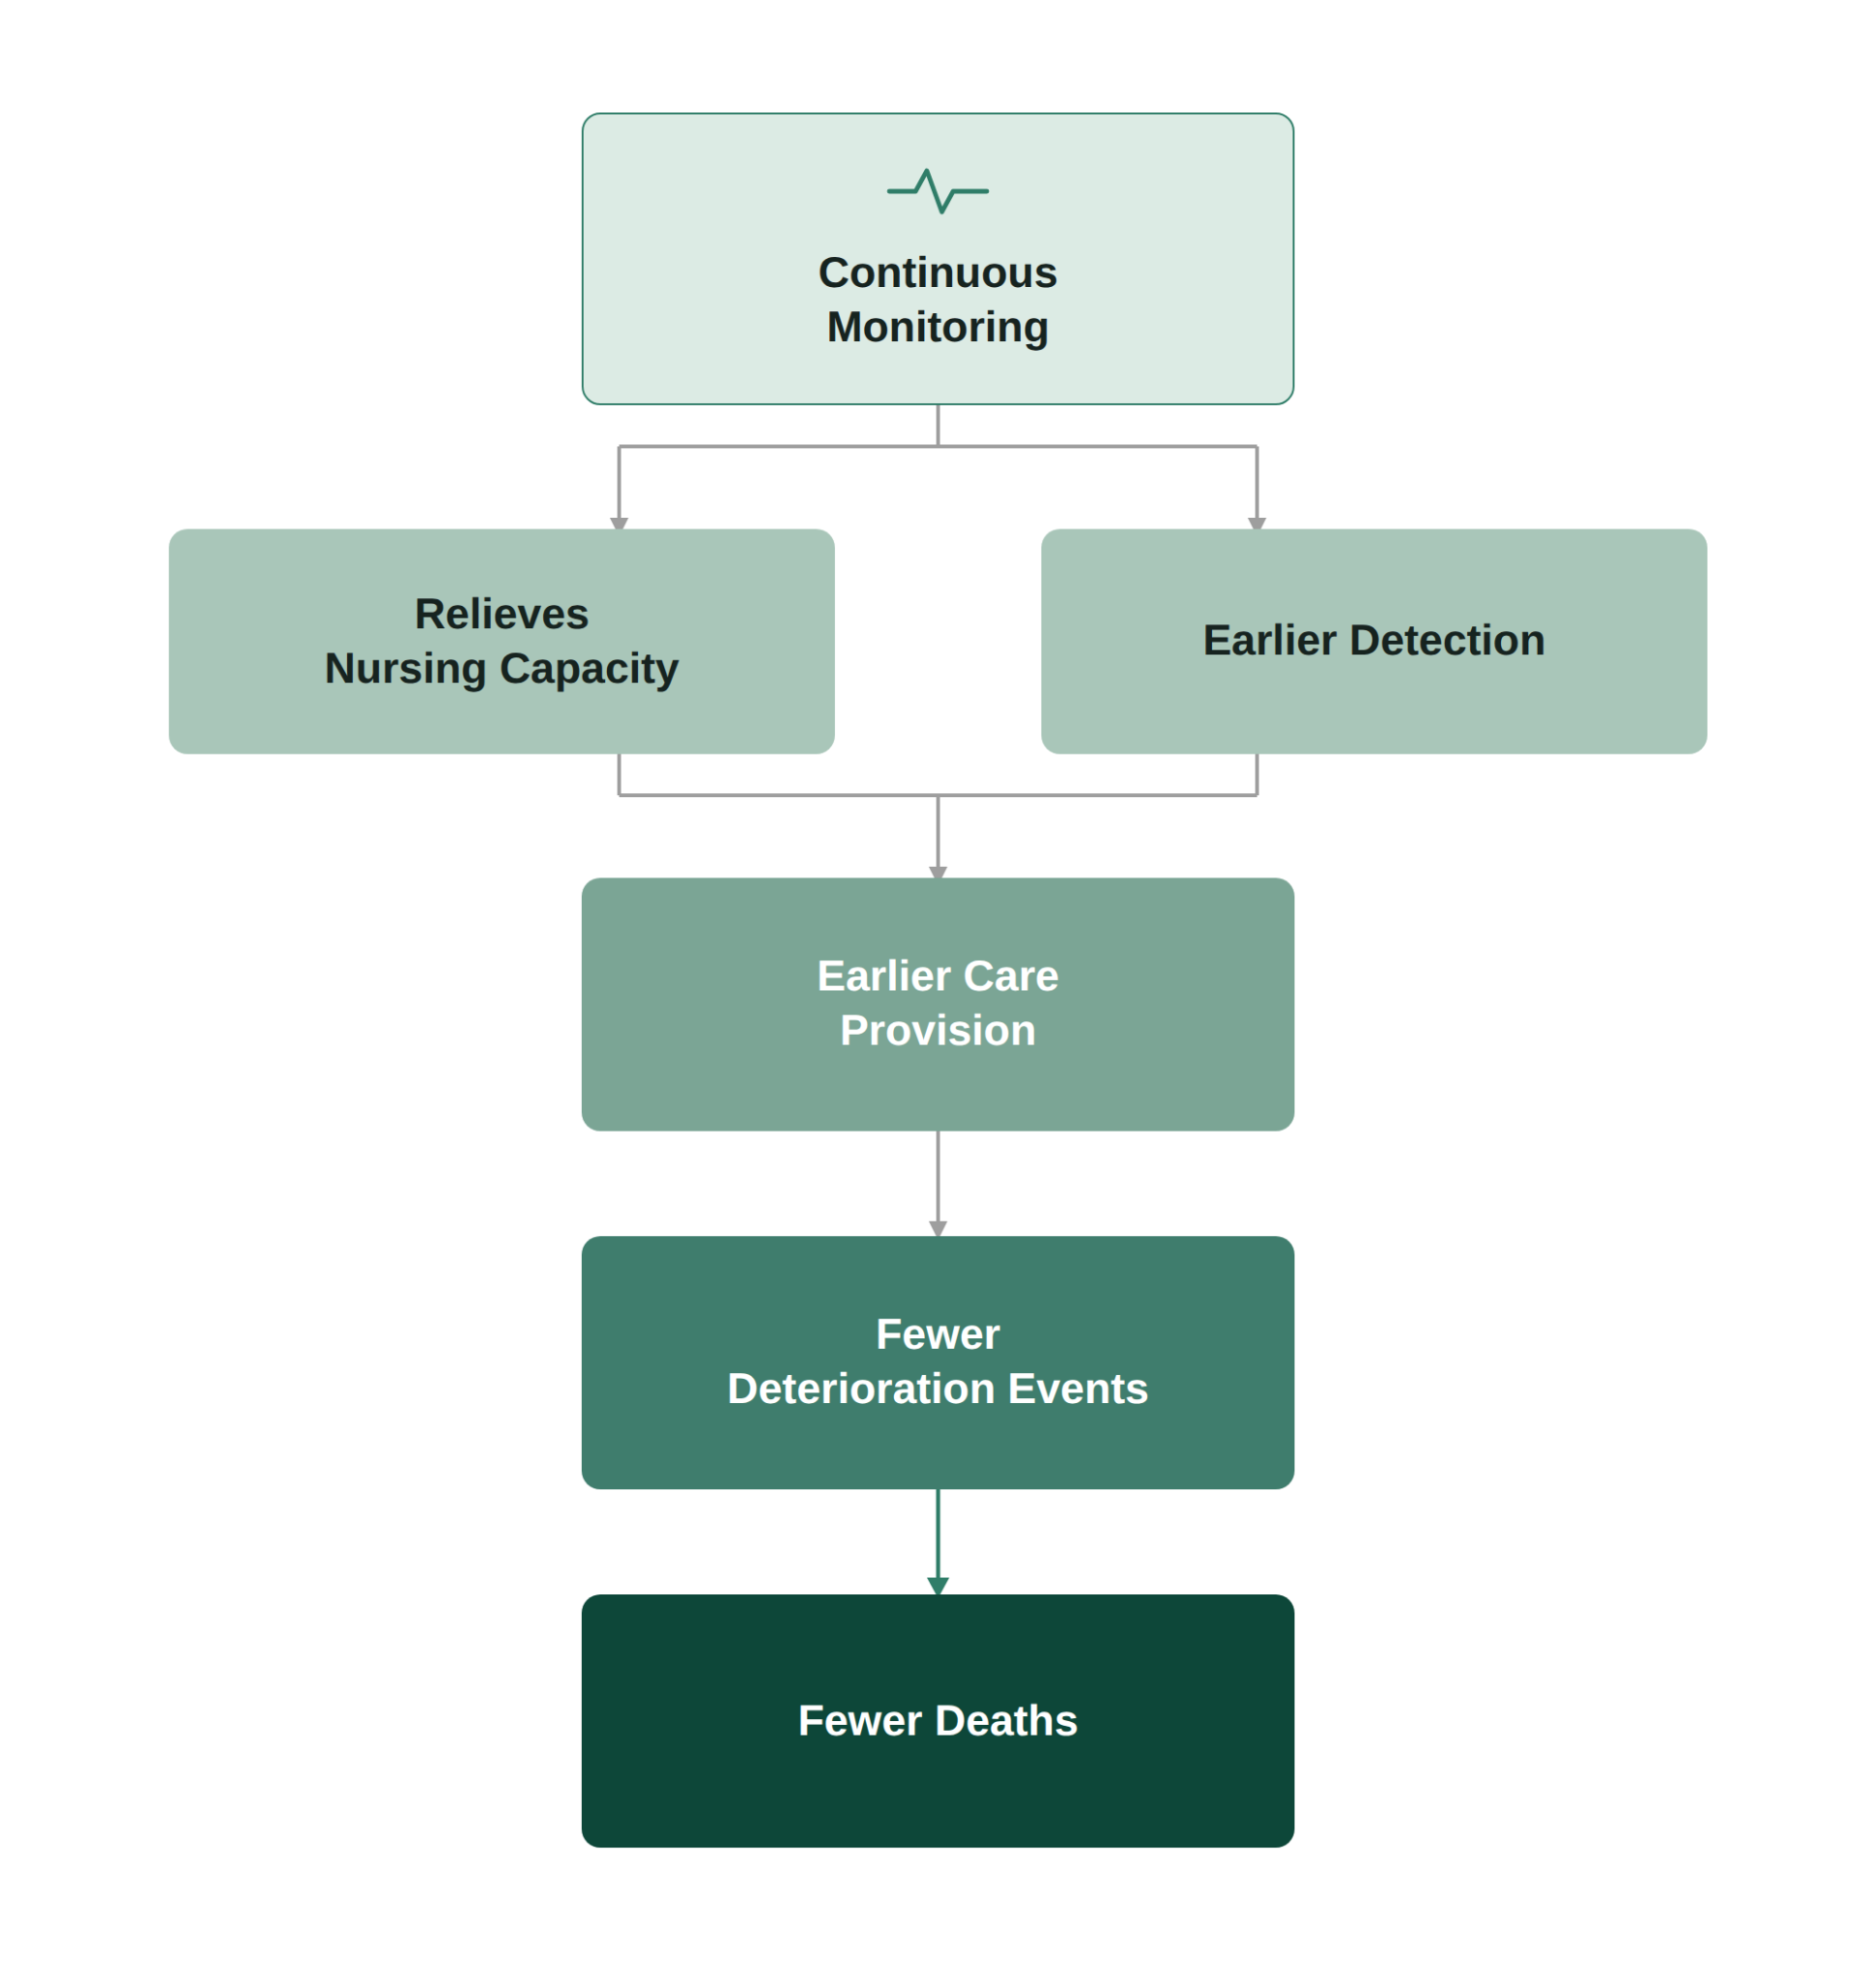
Continuous patient monitoring is proposed to reduce mortality in low-resource pediatric and neonatal wards through a two-pronged mechanism: freeing up nursing time otherwise spent on manual vital-sign checks, and catching physiological deterioration earlier than intermittent spot-checks would. Both pathways are meant to result in care reaching a deteriorating child faster, which in turn should reduce the number of children who progress to critical illness, and ultimately reduce deaths (Figure 1).
Figure 1: Simplified theory of change for the IMPALA system
IMPALA’s Evidence Generally Signals a Decrease in Mortality
Table 1 below shows GOAL 3’s full body of evidence for IMPALA implementation in both pediatric and neonatal wards.
Table 1: IMPALA evidence base, as of September 2026
| Setting | Ward | Study Design | Sample Size | Mortality Reduction, pp (95% CI) | Mortality Reduction, Relative (95% CI) | Statistically Significant? | Source |
|---|---|---|---|---|---|---|---|
| Malawi (ZCH) | Pediatric, general | Before-after, TMLE-adjusted | 1,840 (pre); 6,255 (post) | 1.9pp (0.6–3.8pp) | 50% | Yes, p=0.01* | Ben et al. (2026) |
| Malawi (ZCH) | Pediatric, HDU | Before-after, TMLE-adjusted | 248 (pre); 736 (post) | 9.8pp (-5.0–26.5pp) | >100%† | No, p=0.22* | Ben et al. (2026) |
| Malawi (SLH) | Pediatric, general | Before-after, TMLE-adjusted | 930 (pre); 1,126 (post) | 1.6pp (0.2–3.2pp) | 40% | Yes, p=0.04* | Ben et al. (2026) |
| Malawi (SLH) | Neonatal, NICU | Interrupted time series, matched control hospital | 535 (pre); 508 (post) | – | 27% (-93%–148%) | No, p=0.66 | Chihana et al. (2026) |
| Malawi (MDH) | Neonatal, NICU | Interrupted time series, matched control hospital | 903 (pre); 1,329 (post) | – | 35% (1–70%) | Yes, p=0.04 | Chihana et al. (2026) |
| Tanzania (SDH) | Pediatric, HDU | Before-after, uncontrolled | – | 0.5pp (95% CIs not given) | 11% | No statistical testing | GOAL 3 & Ifakara Health Institute (2024, p. 11 ) |
| Tanzania (SDH) | Neonatal, NICU | Before-after, uncontrolled | 1,519 (post) | 3.4pp (0.0–6.8pp)** | 27% | Yes, p<0.05 | GOAL 3 & Ifakara Health Institute (2024, p. 10) |
| Rwanda (NH) | Neonatal, NICU | Before-after, uncontrolled | – | 2.0pp (-0.3–4.3pp)* | 20% | No, p=0.08 | Dine et al. (2025) |
| Rwanda (RH) | Neonatal, NICU | Before-after, uncontrolled | – | -0.1pp (-1.7–1.5pp)* | -2% | No, p=0.90 | Dine et al. (2025) |
Note. *95% CI or p-value imputed, not given directly by GOAL 3. Based on either a GOAL 3-provided p-value or 95% CI. **95% CIs imputed, not given directly by GOAL 3. Based on p=0.05 (most conservative); p-value given by GOAL 3 is p<0.05. †The estimated pp reduction after TMLE exceeds the total mortality rate before IMPALA, making this estimate unreliable. PP = percentage point; CI = confidence interval; HDU = High Dependency Unit; NICU = Neonatal Intensive Care Unit; ZCH = Zomba Central Hospital; SLH = St. Luke’s Hospital; MDH = Mchinji District Hospital; SDH = Sengerema District Hospital; NH = Nyamata Hospital; RH = Rwamagana Hospital; TMLE = Targeted Maximum Likelihood Estimation. IMPALA implementation was only done directly in HDUs and NICUs; analysis of general pediatric wards therefore includes patients who were not monitored. “Pre” and “post” sample sizes refer to the population size pre-IMPALA and post-IMPALA implementation, respectively.
Reductions in Mortality in Pediatric Wards
GOAL 3 ran a pilot study implementing IMPALA in the HDUs of pediatric wards in two hospitals in Malawi from January 2023 to May 2024, with comparison data drawn from 2022–2023. An initial analysis of the pilot found a 59% relative reduction in mortality (p<0.05) in the pediatric ward of St. Luke’s Hospital (SLH) (Geubbels et al., 2024). A later analysis covering the full implementation period (Ben et al., 2026) found a slightly more conservative 40% reduction in mortality (p=0.04) at SLH over the pilot’s full time period, while a parallel implementation at Zomba Central Hospital (ZCH) estimated a 50% mortality reduction (p=0.01) compared to counterfactuals (ibid.). Outside of Malawi, IMPALA was tested in a pediatric HDU in Tanzania, where an 11% mortality reduction was observed; however, this was only measured after three months of IMPALA use, and no statistical testing of the data was conducted by GOAL 3, so we place little weight on the magnitude of the result.
Reductions in Mortality in Neonatal Wards
IMPALA has also been implemented in NICUs in Malawi, Tanzania, and Rwanda. Evidence from Malawi comes from a controlled interrupted time series analysis of two early-adopter hospitals, in which monthly neonatal mortality trends the year before and after IMPALA’s introduction were compared against matched control hospitals. This is the only evidence for either pediatric or neonatal mortality reduction that uses a matched control group rather than a simple before-after comparison, which makes it more resistant to concurrent confounders (e.g., seasonality, economic shocks). The analysis reported a 35% relative reduction in neonatal mortality (p=0.04) in one intervention hospital and a 27% reduction in the other (p=0.66) (Chihana et al., 2026). These are two broadly similar point estimates with very different p-values, which is a signal of low statistical power rather than what we would expect to be a real difference between sites. We therefore treat this result as the strongest directional evidence for a neonatal mortality effect in GOAL 3’s evidence base, but not as a reliable point estimate.
In Tanzania, GOAL 3 also estimated a 27% reduction in neonatal mortality (p<0.05) in one hospital, though the design of the study was weaker than in Malawi (only a before-after comparison, with no matched control hospital). In Rwanda, implementation across two hospitals yielded non-statistically significant results, with one estimating a 20% drop in mortality (p=0.08) and the other a 2% increase in mortality (p=0.90). The latter is the only point estimate in GOAL 3’s evidence base that shows a directionally different outcome, but a p-value close to 1 and the small absolute change in mortality mean that this is best interpreted as noise around a true null effect. Furthermore, in the hospital which yielded this result (Rwamagana Hospital), baseline neonatal mortality was already markedly lower (at 4.3%) than at any other IMPALA site, leaving little room for an intervention to produce a measurable reduction. We therefore treat this data point as a reminder that the true effect of IMPALA may be smaller in settings where care is already reasonably good at baseline.
How Should We Interpret GOAL 3’s Data?
Reasons to be Optimistic
- Results point consistently in the same direction across several different settings and types of implementation. Malawi, Rwanda, and Tanzania have all produced favorable estimates of mortality reduction with IMPALA. A consistent direction across independent implementations is harder to explain by chance than any one result considered alone. GOAL 3 has also published statistically non-significant findings, which gives us confidence that we are assessing its full body of evidence, not only a favorable subset.
- Detecting mortality differences is inherently difficult, and multiple detections of reduced mortality is unusual. Death is a comparatively rare outcome even in high-dependency settings, so the sample sizes needed to establish a mortality effect are far larger than for other outcomes. Studies that convincingly demonstrate mortality reductions are rare across global health generally, which should give us confidence that there is an effect, even if the exact magnitude is unclear.
- There is a plausible mechanism for the effect. The causal chain is as follows: relieving nursing capacity and earlier detection → earlier care provision → fewer deterioration events → fewer deaths (see Figure 1). IMPALA found evidence for some of these links (e.g., reported time spent on vital-sign monitoring fell from 3.3 to 1.8 hours daily (Mwale et al., 2025)), and GOAL 3 states that a separate analysis of HDU data “showed an increase in care provision across all categories (antibiotics, anticonvulsants, etc.) except oxygen use” (GOAL 3, personal communication), indicating actual changes in care.[3]
- The counterfactual situation is poor in many LMIC contexts, which lowers the bar for a real effect. Standard care in a pediatric HDU in one of GOAL 3’s hospitals in Malawi is manual observations every six hours supported by two mobile monitors, one pulse oximeter, four oxygen concentrators, and a non-functional wall-mounted monitor, for an eight-bed unit where children routinely share beds (Mwale et al., 2024). Against such a weak baseline, a modest improvement is more plausible than the same effect size would be in a well-resourced setting.
- Variable effects across sites are not inconsistent with what an effective intervention would be expected to produce. Baseline mortality, staffing, referral patterns, and treatment availability can differ substantially between implementing hospitals, and all of them affect whether a detected deterioration can actually be acted upon. Heterogeneity in results is therefore consistent with a real effect operating under different conditions, and is not by itself evidence against one.
- Low statistical power means the evidence is unable to rule out no effect, not that the intervention doesn’t work. Several analyses are underpowered, and a non-significant result from an underpowered study generally says little either way. The converse is equally true, however: low power is not in and of itself a reason to believe that a favorable point estimate represents a real effect either.
- Morbidity findings have better statistical power and are unambiguous. Ben et al. (2026) state that while the study was underpowered for mortality, it did have enough statistical power to detect differences in critical illness events (CIEs). The CIE effects are large (26pp–47pp decrease), tightly estimated (even lower bounds reflect 20pp–40pp differences), and consistent across both sites. This is a strong quantitative signal in the same direction as the mortality benefits.
Reasons to be Skeptical
- The evidence base is entirely non-randomized, and only partly controlled.[4] Almost all of it rests on before-after comparisons, with a single controlled interrupted time series providing the only genuine comparison sites. Quasi-experimental designs of this kind have a real advantage, in that they observe the intervention in ordinary wards rather than in artificial trial conditions, so what they measure is closer to how the intervention would actually be used. But the cost is that treatment and comparison groups are never assembled at random, so any pre-existing difference between them (e.g., severity of conditions, staffing, referral patterns) can masquerade as an effect of the device. That makes it substantially harder to attribute an observed mortality change to the intervention, rather than whatever else distinguishes the periods or sites being compared.
- Note that a traditional randomized controlled trial may be genuinely hard to run in this context: a monitoring system cannot be disguised as a placebo, and it may change how the whole ward operates. For example, staff know when the monitors are present, and the intervention is bundled with training and supervision. The observed effect size therefore reflects both the device plus the attention surrounding it (i.e., the Hawthorne effect[5]), but this observation component may be less present in a wider rollout (though GOAL 3’s subscription service includes continuous support for hospital staff, which could plausibly reduce this type of bias).
- Several of the individual mortality results are compatible with no effect at all, or a very small one. In a number of the site-level analyses, the data cannot distinguish a substantial benefit from no benefit (i.e., the confidence interval crosses zero), or the lower bound indicates a plausibly negligible mortality reduction.[6]
- The highest estimate of a mortality reduction (50%) comes from assumed spillover effects. IMPALA was installed in the high-dependency unit (HDU) at Zomba Central Hospital (ZCH), not in the general pediatric ward. At ZCH, 446 children were actually monitored, making up 61% of the HDU cohort but only 7% of the total pediatric ward cohort that produces the statistically significant result (3.8% to 2.8%, adjusted −1.9pp mortality reduction, 95% CI −3.8 to −0.6) (Ben et al., 2026). In the HDU itself, observed crude mortality rose slightly (from 8.1% to 9.0%), with an adjusted estimate that is large but not statistically significant (9.8pp reduction in mortality, 95% CI −5.0–26.5pp) (ibid.). Therefore, roughly 93% of the children in the population showing the benefit were not those in the ward with IMPALA, which places a large assumption on spillover effects from the HDU ward actually occurring.
- Unusually large effects tend to shrink with more data. Where results are estimated from small samples, the ones that look most impressive are disproportionately likely to have been favored by chance, and subsequent measurement typically pulls them back toward more modest values (i.e., regression to the mean).
- The strongest research design coincided with unusually severe background disruption in Malawi. The study of neonatal mortality in Chihana et al. (2026) is the only one in which control hospitals are used. However, mortality fluctuated substantially between before and after periods across multiple hospitals included in the study: in one intervention hospital, mortality rose by ~50%, while in one control hospital, it halved. GOAL 3 explains these background changes as “major external shocks (Malawi’s economic crisis and a cyclone plus a drought causing widespread food insecurity) occurring within the same period as IMPALA introduction” (GOAL 3, personal communication), actually prompting a research change to a controlled design. However, with only one control hospital per intervention site, any background shock at that single control facility may be indistinguishable from a valid counterfactual trend.[7]
Does Other Evidence Show that Continuous Monitoring Meaningfully Reduces Mortality?
Standard of Care Monitoring in Low-Resource Settings
IMPALA is compared to the standard of care in low-resource settings, in which monitoring protocols require intermittent checks on patients. In Malawi, where several of GOAL 3’s implementation studies have been conducted, this involves manual monitoring of vital signs four times per day (every six hours), or more frequently if necessitated by the child’s condition (Mwale et al., 2024). We also spent ~1 hour looking for standard monitoring data from Tanzania and Rwanda (the other two countries in which IMPALA has been implemented) but did not find specific reports of how standard-of-care monitoring differs compared to Malawi; however, we assume across most LMIC settings in which IMPALA would be implemented that continuous monitoring would not be available otherwise.
Protocols also do not necessarily dictate realistic conditions, particularly in low-resource settings. For example, one observational study of vital signs monitoring in children admitted to hospitals in Kenya found that most hospitals, on average, only conducted half of the intended number of vital signs manual checks expected for in-patient stays lasting at least 48 hours (Ogero et al., 2018). This paper is moderately out-of-date, but we expect that staff resourcing challenges in LMICs have not changed meaningfully in the last eight years and that standard-of-care intermittent monitoring occurs infrequently in resource-constrained settings.
Other Evidence of Continuous Monitoring and Triage on Mortality
We performed a brief scan of the literature on continuous monitoring and pediatric early warning systems (PEWS) to inform our understanding of plausible effect sizes and mechanisms of effect. Almost all studies on continuous monitoring have been conducted in high-income countries (HICs), where evidence is somewhat mixed, but generally supports the principle that continuous monitoring leads to better health outcomes.
- Evidence of continuous monitoring for adults in HICs is mixed, but directionally supports the principle that continuous monitoring leads to better health outcomes.
- One meta-analysis of largely US-based hospitalized adult patients not in intensive care units found that those who had at least two vital signs continuously monitored had a 39% decreased mortality risk (95% CI 5–61%) compared to patients with regular intermittent monitoring (Sun et al., 2020).
- Another US-based observational study of continuous monitoring among adults in a surgical ward found that patients with intermittent monitoring were more likely either to die or be admitted to the ICU (odds ratio of 3.42, 95% CI 3.19–3.67, p<0.001) than those with continuous monitoring (Rowland et al., 2024).
- However, two systematic reviews and meta-analyses of continuous monitoring in HICs found no effect on mortality. One study of wearable vital sign monitoring systems across Europe and the US found no statistically significant difference in mortality (risk ratio of 0.48, 95% CI 0.18–1.29) or any other proxies for improved health outcomes (Areia et al., 2021). Another study of randomized controlled trials (RCTs) comparing patients not in critical care who received continuous versus intermittent monitoring found the pooled odds of mortality to be 0.95 (95% CI 0.59–1.53, p=0.84) (Bowles et al., 2024). Nevertheless, both studies directionally point to a decrease in mortality, and the authors of Areia et al. specifically note that their evidence is not conclusive due to research design and outcome differences across studies. Particularly in HICs, in-hospital mortality is also a relatively rare event, meaning that trials comparing continuous to intermittent monitoring may be generally underpowered to detect a significant decrease in mortality.
- Effective triage of critically ill children reduces mortality.
- One systematic review and meta-analysis (Chong et al., 2022) of the pediatric early warning system (PEWS), a bedside scoring tool of vital signs and clinical observations that is an integrated part of IMPALA, found that patients with PEWS had a ~15% lower risk of mortality (95% CI 1–28%, p=0.04). Though this study specifically investigated only one element of IMPALA and evidence is mostly from HICs, we interpret this as external evidence that improved monitoring and triage of critically ill patients has at least some positive effect on mortality.
- Additional continuous monitoring can reduce neonatal mortality in NICUs.
- Moorman et al. (2011) conducted an RCT of very low birth weight infants in HICs in which continuous heart-rate variability patterns, which are predictive of sepsis, were displayed to clinicians already doing continuous monitoring as standard NICU care. The mortality rate in infants whose heart rate monitoring was displayed dropped from ~10% to ~8% (hazard ratio of 0.78, 95% CI, 0.61–0.99, p=0.04). Though this is a substantially different intervention from IMPALA (i.e., some form of continuous monitoring already existed in this setting), it further supports the idea that increased monitoring does reduce mortality.
Potential Risks of Continuous Monitoring
Continuous monitoring is standard of care in HICs, reflecting general acceptance that more monitoring leads to better health outcomes. However, the main risk of additional monitoring is alarm fatigue—i.e., repeated false or non-actionable alarms that lead to clinician desensitization and missed critical alarms—which represents a credible threat to the quick response times necessary to drive mortality reduction. In the US, such “nuisance” alarms have been estimated to account for >80% of all monitor alarms and have been linked to patient deaths (Cvach, 2012).
GOAL 3’s own data indicate this risk is present in IMPALA implementation as well. Its internal evidence tracker lists “disconnects and false alarms” as an improvement priority, though there has already been a reported ~40% reduction in alarm burden across ~900 monitored shifts (GOAL 3, 2026). A usability study at ZCH’s pediatric HDU also found that approximately a third of surveyed healthcare workers cited frequent or false alarms as a challenge (Chirambo et al., 2024). However, no data in the evidence base measured whether this degraded response times or contributed to mortality outcomes within the study populations. The appropriate conclusion is therefore that alarm fatigue is a plausible and partially evidenced offsetting risk that has not been fully quantified. We think it is unlikely that alarm fatigue would outweigh or substantially offset the benefits of continuous monitoring, but note that we have not incorporated any potential negative effects into our cost-effectiveness analysis below.
Translating External Evidence from HICs into Low-Resource Settings
We think there are two important, countervailing considerations to keep in mind when trying to apply these findings from HICs to LMICs:
- The marginal value of continuous monitoring is likely larger in LMICs than the HIC studies suggest. In most HICs, the comparator is already at least frequent monitoring, often backed by rapid response teams, so the studies above can only estimate the benefit of adding monitoring on top of a relatively high-quality baseline. In the settings where IMPALA is deployed, the counterfactual is instead intermittent manual observation every ~6 hours (and possibly even less in practice), so the same technology has far more scope to catch deterioration that would otherwise go unnoticed. Baseline mortality is also higher, leaving more absolute deaths to avert. This is a central reason we regard the HIC effect sizes as likely conservative for LMIC contexts.
- Monitoring only reduces mortality if a detected deterioration can actually be acted upon, and healthcare in LMICs is likely to be weaker in this respect. Earlier warning has to be met by, e.g., an available clinician, the right medication in stock, and a functional referral pathway; where any of those links are missing, an early alert of deterioration may not translate into a life saved. Freed nursing capacity also only helps if it is redirected to other necessary care, and the patient mix likely differs substantially (e.g., malaria, malnutrition, neonatal sepsis, and later presentation).
Taken together, the literature supports the direction of an effect and a plausible mechanism, but we have very low confidence in applying its magnitude directly into an LMIC setting.
Other Potential Effects of IMPALA Beyond Reducing Mortality
Outside of mortality benefits, GOAL 3 estimates that continuous monitoring leads to other improved health outcomes and cost savings for both hospitals and families. Effects that could plausibly feed into a cost-effectiveness analysis[8] include:
- Reduced morbidity: In the HDU at ZCH, critical illness events (CIEs) fell by an adjusted 47pp (95% CI 42–53pp), while at SLH they fell by an adjusted 26pp (95% CI 21–30pp) (Ben et al., 2026). However, GOAL 3’s figures show that this is only a minor contributor to the overall benefits (roughly 3–4% of the estimated total number of DALYs averted by IMPALA[9]). The authors also flag that their own DALY estimates are likely underestimates, since disability weights came from a limited set of chronic diseases and the years of life lived with disability (YLD) component was capped at the hospitalization period only, but we do not expect that inclusion of additional morbidity would change the value attribution substantially.
- Decreased length of stay: In both general pediatric wards in Ben et al. (2026), length of stay decreased by 0.1–0.5 days (though neither finding was statistically significant). If this were a real effect, it could save hospital costs associated with bed-days,[10] though we have low confidence in cost savings, given that there is no clear effect size and that length of stay can be easily confounded (e.g., by admission mix or seasonality).
- Staff time savings: Mwale et al. (2025) found that staff self-reported spending 3.3 hours (95% CI 2.4–4.2 hours) per day on child monitoring before IMPALA’s introduction, compared to 1.8 hours with IMPALA (95% CI 1.2–2.5 hours). This is mechanistically plausible (continuous automated monitoring displacing manual vitals checks is unlikely to be confounded), but as self-reported data, it may also be susceptible to bias (e.g., social desirability).
- Caregiver burden reduction (i.e., the societal perspective): In Ben et al. (2026), societal costs—i.e., direct non-medical costs (transport, food, lodging) plus indirect costs (income lost due to missed work) borne by family or other caregivers—decreased in both pediatric wards (by ~$12–$45 per admission), but findings were not statistically significant. As with length of stay, none of these estimates conclusively demonstrate a benefit, and the societal cost reductions are largely a downstream function of the reduced length-of-stay effect rather than an independently measured pathway, so we similarly have low confidence in their true value from the viewpoint of cost-effectiveness.
Cost-Effectiveness Model
Methodology
Cost of Providing the IMPALA System
The system as a whole is composed of two components: one-off costs ($21,850, composed of equipment,[11] a 5-year warranty, installation, configuration, implementation, onboarding, and training costs) and recurring costs ($2,811 annually, including the maximum, all-inclusive service[12] and a 30% 5-year contract discount). Not included in the one-off equipment costs are taxes, duties, travel, and transport; GOAL 3 expects these costs to vary widely by setting, but estimates taxes and duties (if charged) to account for an additional ~5% of the equipment costs only, and transport to cost <$500, with ~$250 as a baseline estimate (GOAL 3, personal communication). The equipment is expected to have a lifetime of roughly 7 years,[13] leading to a total expected average cost to the health system of ~$6,100 per year. At scale, GOAL 3 expects recurring costs to be ~50% lower than the maximum, including both the 5-year contract discount (30%) and documented large-order scale pricing (a further 20–30% reduction).
We largely take GOAL 3’s cost data at face value because it reflects pricing drawn from its actual operating business model that has already been deployed across multiple hospitals and countries. Nevertheless, we use conservative cost assumptions (e.g., we do not assume at-scale pricing in our baseline estimates) and use ranges in our sensitivity analysis to account for potential price differences.
Cost-Effectiveness Model
We assessed the potential cost-effectiveness of GOAL 3’s IMPALA system using back-of-the-envelope calculations (BOTECs) (see full model parameters and results in this spreadsheet). We deliberately use conservative values for parameters in our baseline scenario so that our headline results reflect what the evidence can genuinely support, rather than the most optimistic interpretation of it. Our BOTEC estimates a realistic value-for-money of implementing the standard 10-monitor IMPALA package separately for both a pediatric and a neonatal ward, using the following assumptions:
- Setting: We do not explicitly assume a specific locale for implementation in order for our results to be broadly generalizable to potential LMIC countries in Sub-Saharan Africa. However, most of the data we incorporate comes from GOAL 3’s studies in Malawi; we expect that some of the values attached to parameters in our model (e.g., mortality rate, annual admissions) could change substantially based on a different setting or type of hospital. We broadly account for this using our external validity adjustments (see below).
- Costs: We calculate the annualized cost of implementing IMPALA from the health provider perspective, including both the one-time costs alongside the annual costs (detailed above). Our estimates are deliberately conservative for our baseline calculations, taking the maximum expected cost of each line item, with no assumed decrease in costs at scale[14] other than a 5-year contract discount, to ensure that all potential health provider costs are covered. This equates to a total annual cost of ~$6,100 over the lifetime of the product, from the provider perspective. We do not take into account potential cost savings generated by implementing IMPALA (e.g., reduced costs due to lower morbidity or fewer patient bed days), largely because we assume that any potential savings would be reaped by the health provider but not by the organization funding the initial investment in IMPALA.
- Annual ward admissions: For pediatric wards, we base our cost-effectiveness estimate on a hospital with ~3,000 annual admissions, as GOAL 3 recommends for planning purposes (GOAL 3, personal communication). This is based on average annual pediatric ward admissions (~3,300 patients) across four hospitals studied by GOAL 3 pre-IMPALA implementation and external data from Malawi indicating ~2,500–5,000 pediatric admissions per hospital per year (Stanley et al., 2023). However, even within Malawi, GOAL 3 data showed a wide range of admissions, with ~1,000 annual admissions at SLH (a smaller district-level facility) versus ~5,000 at ZCH (a large referral and teaching hospital), though the number of monitors would be expected to scale roughly linearly based on ward size. For implementation in a NICU, we use a central estimate of 1,000 annual admissions (see, e.g., Mgusha et al., 2021 and Gondwe et al., 2022), which is substantially lower than for a pediatric ward due to increased monitoring requirements for neonates.
- Health benefits: We calculate the health benefits attributed to IMPALA preventing child deaths, which we convert into disability-adjusted life-years (DALYs). We do this both from a traditional global health perspective (in which more DALYs are always averted from preventing a death earlier in life) as well as from an effective altruism (EA) perspective. The EA conversion is based on GiveWell’s treatment of deaths at different ages (i.e., its moral weights [GiveWell, 2025]), which weights DALYs differently than a traditional framework in that it places the highest value on averting deaths slightly later in life (based on moral preference surveys). We do not include additional effects that might result from the intervention (e.g., reduced morbidity or effects from the societal perspective).
- Discount rates: From the traditional global health perspective, we provide both undiscounted and discounted estimates of the cost per DALY averted, applying a central 3% discount rate to both costs and health benefits—the rate used in the World Health Organization (WHO)’s Choosing Interventions that are Cost-Effective (CHOICE) program (Bertram et al., 2021)—which gives costs and health accrued in the future less weight than the same amounts today. For the estimates from the perspective of EA organizations, we do not apply a temporal discount to either costs or benefits, reflecting a common view in effective altruism that rejects pure time preference (such that a year of healthy life is not treated as less valuable simply because it is lived later).
- Ward mortality rates: In Ben et al. (2026), pediatric ward mortality was 3.8% and 4.0% at ZCH and SLH, respectively. We adopt the slightly more conservative estimate of 3.8% as the basis for our model. Neonatal mortality was higher and more dispersed in the GOAL 3 hospitals, ranging from 4.3–27.8% across seven hospitals in Malawi, Rwanda, and Tanzania, pre-IMPALA implementation.[15] We chose a central estimate of 10% neonatal mortality to err on the conservative side,[16] acknowledging that the mortality rate may vary substantially by facility based on admission criteria, local disease burden, and staffing ratios, among additional factors.
- Effect of mortality reduction with IMPALA: We estimate two scenarios of IMPALA reducing mortality: in a general pediatric ward and in a neonatal intensive care unit (NICU).[17] For a baseline estimate of mortality reduction in the pediatric ward, we used a weighted average of the estimated effect size from the two hospitals in Ben et al. (2026) and one hospital in Tanzania (GOAL 3 & Ifakara Health Institute, 2024), leading to an overall effect size of 42%[18] (before adjustments). We likewise used a weighted average of five estimates of reduced neonatal mortality in the NICU, equating to a 26%[19] baseline mortality reduction for neonates. Both baseline estimates were further adjusted downwards using our subjective value judgments for internal and external validity (see below).
- Internal validity: This adjusts the reported treatment effect to reflect the possibility that weaknesses in research design[20] may cause the reported estimate to differ from the intervention’s true causal effect.[21] We apply a 60% downward adjustment to GOAL 3’s estimated reductions in pediatric ward mortality and NICU mortality, which is broadly consistent with GiveWell’s internal validity adjustments for non-randomized, quasi-experimental research designs (e.g., acute malnutrition treatment; see Appendix A).[22] Specifically, this adjustment primarily takes into account the following factors:
- Quasi-experimental design: None of the mortality effect estimates come from a randomized design, and most rely on a before-after comparison that cannot rule out unmeasured confounding the way that randomization does.
- Wide confidence intervals: Half of the mortality estimates that were statistically tested (in Table 1) cannot rule out that there is no effect, and even the statistically significant results have bands wide enough to leave uncertainty about the true magnitude of the effect. This may reflect underpowering, but lack of statistical power means the results are merely inconclusive, not that there was definitively an effect that was not captured.
- Major background changes in hospital admissions. In Malawi, major external shocks took place simultaneously with IMPALA implementation. Though the GOAL 3 analyses attempted to control for these factors, statistical analysis cannot detect bias from confounders that were never included or mismeasured, and substantial background changes weaken our confidence in counterfactual trends in mortality without IMPALA.
- For pediatric effect sizes: reliance on spillover effects. A substantial portion of the claimed effect depends on an unmeasured spillover mechanism (e.g., freed nursing capacity, shifted triage practices, or improved general ward routines), extending the benefit to children who were never actually on an IMPALA monitor. This is a plausible mechanism, but an additional inferential step beyond child survival due to monitoring alone.
- For neonatal effect sizes: Evidence is noisier and more heterogeneous than for pediatric implementation (ranging from a 35% reduction to a 2% increase in mortality) and is based on smaller or unavailable sample sizes. However, it also contains data from the only controlled research design and does not rely on spillover effects, so on balance, we rate it as broadly comparable to the pediatric evidence base.
- External validity: This adjustment reflects the generalizability of results; it reduces a study’s reported treatment effect size to account for the fact that the context it was measured in may differ in important ways from settings in which it could be applied. The values we apply below are also broadly consistent with GiveWell’s approach to external validity discounts (e.g., generalizability discounts for breastfeeding promotion and seasonal malaria chemoprevention; see Appendix B).[23]
- We apply a 30% downward external validity adjustment for both pediatric and neonatal implementation because IMPALA’s observed mortality effects in this population have only been measured strongly across a small number of hospitals in three countries, and whose baseline characteristics (e.g., admissions, referral patterns) already diverge enough that effect sizes are not clearly consistent across sites.
- Our model assumes IMPALA reduces ward mortality uniformly, but some deaths likely cannot be prevented by better monitoring. We are unsure how much the mix of presenting conditions varies across hospitals and countries, and thus how much that affects IMPALA’s potential to save lives.
- Furthermore, part of IMPALA’s effect depends on how staff actually interact with the technology, which can vary unpredictably, is not easy to estimate in advance of implementation, and can suffer from potential Hawthorne effects.[24]
- Note that quasi-experimental design, which is a reason why we discount internal validity above, is a reason not to discount external validity too heavily, as it means the intervention was implemented in something closer to a real-world setting than, e.g., a rigorous RCT.
- We also note that IMPALA’s operational footprint is much broader than the hospitals included in the studies in Table 1, with ~50 hospitals across six countries[25] (GOAL 3, personal communication). However, as we could only evaluate effect sizes in a small proportion of these hospitals, we believe that our external validity discount is appropriate here, and would reconsider it with more evidence from additional settings.
- Cost-effectiveness perspective: We investigate cost-effectiveness from three alternative viewpoints: (1) a traditional cost per DALY averted framework, relative to different willingness-to-pay (WTP) thresholds for LMICs (roughly $250–$600/DALY averted);[26] (2) Coefficient Giving (CG)’s perspective, in which we calculate the Social Return on Investment (SROI) compared to a 1,000x cost-effectiveness bar, in units of value equivalent to giving $1 to someone earning $50,000 per year; and (3) GiveWell (GW)’s perspective, in which cost-effectiveness is compared to a 6x bar, in multiples of unconditional cash transfers.
Results
Our Estimates Show IMPALA to be Highly Cost-Effective
We estimate that IMPALA implementation in LMIC settings is highly cost-effective for both pediatric and neonatal ward implementation, from any funder perspective we applied (Table 2 below):
Table 2: Cost-effectiveness of the IMPALA system for pediatric and neonatal implementation from three different funder perspectives
| Value (Range) | ||
|---|---|---|
| Cost-Effectiveness Perspective | Pediatric | Neonatal |
| Traditional global health perspective | ||
| Cost per DALY averted (undiscounted) | $7 ($1–$163) | $12 ($2–$133) |
| Cost per DALY averted (discounted) | $17 ($1–$674) | $30 ($2–$574) |
| WTP threshold | $250–$600 | |
| Coefficient Giving’s perspective | ||
| Social Return on Investment (SROI) | 11,721x (506x–80,544x) | 4,391x (405x–34,396x) |
| WTP threshold | 1,000x | |
| GiveWell’s perspective | ||
| Multiples of cash transfers | 76x (3x–523x) | 28x (3x–223x) |
| WTP threshold | 6x | |
Note. DALY = disability-adjusted life-year. WTP = willingness-to-pay. Discounted cost per DALY averted estimates include a 3% discount rate. Coefficient Giving calculates SROI in units of value equivalent to giving $1 to someone earning $50,000 per year. Ranges represent low and high values from our sensitivity analysis.
We estimate that, from a traditional global health perspective, pediatric implementation would cost $7–$17/DALY averted, and neonatal implementation $12–$30/DALY averted (in each case, the lower figure is undiscounted and the higher applies a 3% discount rate to costs and benefits). Both ranges sit well below the 0.5x GDP per capita WTP threshold of ~$250–$600 for Malawi, Rwanda, and Tanzania. Even against a more conservative threshold (e.g., the 1–51% of GDP per capita range suggested for a low-income country like Malawi in Woods et al., 2016), both types of implementation clear the bar except in the very strictest willingness-to-pay scenarios.
From the perspective of EA organizations, both types of implementation also comfortably clear the cost-effectiveness bars set by Coefficient Giving and GiveWell. From CG’s perspective, our central estimates are a social return on investment (SROI) of ~11,700x (pediatric) and ~4,400x (neonatal) in CG’s units of value—roughly 12x and 4x above its 1,000x funding bar (Berger & Reid, 2026). From GW’s perspective, we estimate IMPALA’s cost-effectiveness is ~76x (pediatric) and ~28x (neonatal) as good as direct cash transfers, which is about 13x and 5x above its current 6x bar (GiveWell, 2026). In other words, using GW’s framework, we estimate that a dollar spent on IMPALA for pediatric implementation does on the order of 76 times as much good as the same dollar given as an unconditional cash transfer.
Our key takeaways are:
- We think IMPALA is likely to be highly cost-effective for implementation in LMIC settings. While there remains the possibility that the intervention is less effective than we estimate, we think it is unlikely that it has no effect at all, particularly in low-resource settings where health workers are genuinely stretched. Continuous monitoring is the standard of care in HICs, and though evidence is somewhat mixed in these contexts, we have medium to high confidence that more monitoring directionally leads to better health outcomes.
- Neonatal ward implementation is less cost-effective than pediatric ward implementation for the following reasons:
- For the same 10-monitor implementation, fewer patients are covered (1,000 vs. 3,000), as neonates require more monitoring.
- The baseline relative reduction in mortality, before any of our subjective adjustments, is ~40% lower (26% vs. 42%). This also means that we estimate the true effect size to be lower as compared to pediatric implementation (7% vs. 12%).
- From the perspective of EA organizations (CG and GW), moral weights imply that a neonatal death is worth 30% less than a pediatric death, which is a matter of perspective that notably differs from a traditional DALY framework in which averting a death earlier in life always has greater value than one later in life.
- Including effects beyond mortality alone would increase cost-effectiveness further. Because our analysis excluded morbidity and potential cost savings for hospitals and families, we expect that their inclusion would lead to slightly better cost-effectiveness estimates, though we strongly believe that the majority of the impact is due to reduced mortality. Averted morbidity only accounted for ~3–4% of overall DALYs, so we expect that this would have a negligible effect on our cost-effectiveness estimates. We did not have time to examine potential cost savings from the provider’s perspective (e.g., if a government-funded IMPALA directly and the health system costs were lower than without IMPALA), but would expect that if this were the case, the overall intervention would then be cost-saving.
Key uncertainties in our modeled estimates are (1) the true effect of IMPALA on reducing mortality, (2) the annual expected number of ward admissions, and (3) the in-hospital mortality rate. For our baseline assumptions for a pediatric implementation (3,000 annual ward admissions, 3.8% mortality rate, and a yearly cost of ~$6,100 for IMPALA), the minimum effect size needed to meet either the CG or GW bar for cost-effectiveness is ~1%. Comparatively, for our baseline assumptions for a neonatal implementation (1,000 annual ward admissions, 10% in-hospital mortality, and $6,100 yearly for IMPALA), the minimum effect size needed to meet the cost-effectiveness bar is ~2%. This essentially means that the system is inexpensive enough that even if the true effect size is far less than we assume, it would still be cost-effective to implement in LMIC settings.
Conclusions
- The evidence points consistently toward a mortality benefit but does not definitively establish its magnitude. Estimates repeatedly indicate a directional effect on reducing mortality in both pediatric and neonatal wards across multiple countries, and this consistency is harder to explain by chance than any single estimate. However, the evidence base is still entirely non-randomized, mostly before-after comparisons, and several estimates are statistically compatible with no effect, so the true effect size remains unclear.
- IMPALA appears highly cost-effective under conservative assumptions and every funder perspective we applied ($7–$17/DALY averted for pediatric implementation, $12–$30/DALY averted for neonatal implementation, and well above the CG and GW bars, even after 60% internal and 30% external validity adjustments). We believe this is a robust conclusion because it is driven by low cost rather than a large effect: the break-even mortality reduction is only ~1% (pediatric) and ~2% (neonatal), so the conclusion holds even if there is only a very minor mortality benefit.
- IMPALA is very likely a cost-effective use of funds in low-resource LMIC pediatric and neonatal wards, though the case rests on a directionally consistent but individually weak mortality signal rather than a rigorously established effect size. The most valuable next step would be additional controlled evidence from settings beyond the current handful of hospitals, which would increase our confidence in the true effect size.
Contributions and AcknowledgmentsBritta Jewell researched and wrote the report and served as project lead. Abbie Clare managed the project. Special thanks to Jerome Mayaud for helpful comments on drafts, and to Niek Versteegde, Channelijne Hulshof, Eveline Geubbels, and Jelle Schuitemaker at GOAL 3 for their input. Thanks also to Shane Coburn for copyediting, to Thais Jacomassi for bibliography support, and to Ula Zarosa for assistance with publishing the report online. GOAL 3 provided funding for this report, but it does not necessarily endorse our conclusions. |
Appendices
Appendix A: GiveWell Internal Validity Estimates
GiveWell (GW) applies internal validity discounts “to account for the possibility that results presented in academic research may not reflect the actual effect an intervention had on the population or populations studied (GiveWell, 2019, p. 8). These include, but are not limited to, factors like social desirability, bias from unblinded participants or study analysts, confounding, imbalances between treatment and control groups, differential attrition, and publication bias. GW states that it chooses values “that have reasonable-seeming implications, but we do not have a formal process for reaching these values.” Even with the highest quality evidence available, GW also applies at least a minor internal validity adjustment such that effect sizes are never taken fully at face value (GiveWell, 2024).[27] Examples of internal validity adjustments applied by GiveWell are shown in Table A1 below, which represents a non-exhaustive list of its program reviews.
Table A1: Sample internal validity adjustments in GiveWell’s program reviews
| Program | Downward Adjustment | Reason |
|---|---|---|
| Seasonal malaria chemoprevention | 5% | Meta-analysis of multiple recent RCTs, plausible effect size, no specific concerns |
| Insecticide-treated nets | 5% (mortality effect); 60% (long-run income effect) | Mortality: meta-analysis of multiple recent RCTs, plausible effect size, no specific concerns Income: two quasi-experiments, plausible mechanism, plausible effect size |
| Cash incentives for vaccinations | 12% | 13 studies of varying quality, many of which are RCTs, but some include co-interventions bundled into trials |
| Water chlorination | 20% | Meta-analysis of multiple RCTs, but co-interventions bundled into trials |
| Oral rehydration + zinc | 20% (usage); 20% (mortality effect) | Usage: one RCT, lack of blinding and self-reporting by participants Mortality: non-randomized studies and limited available evidence |
| Vitamin A supplementation | 26% | Meta-analysis of multiple RCTs, conducted long ago, somewhat implausible implied effect |
| Breastfeeding promotion | 30–45% | Limited size of the evidence base; uncertainty about uptake in less direct programs; larger discount for different delivery mechanisms |
| Acute malnutrition treatment | 65% | Non-randomized observational data, socioeconomic confounding |
| Deworming | 87% | One RCT, atypical high-burden setting, implausibly large effect, unreplicated |
Note. Sources are GiveWell (2023) and GiveWell (2020).
Appendix B: GiveWell External Validity Estimates
GiveWell applies external validity discounts “to account for differences between the efficacy an intervention had in a studied population and the efficacy expected in other settings” (GiveWell, 2019, p. 9). GiveWell’s external validity adjustments are less well-documented than for internal validity and are sometimes bundled into one overall discount or split into multiple separate adjustments (e.g., one for usage and one for generalizability outside of a region). Examples of external validity adjustments applied by GiveWell are shown in Table B1 below, which represents a non-exhaustive list of its program reviews.
Table B1: Sample external validity adjustments in GiveWell’s program reviews
| Program | Downward Adjustment | Reason |
|---|---|---|
| Insecticide-treated nets | 5–10% (usage); 4–59% (resistance) | Nets used less at scale than in trials; insecticide resistance has grown since the trials, varying substantially by country |
| Oral rehydration + zinc | 15% (usage); 20% (mortality effect) | Health workers gave vouchers to families to encourage uptake; trials might not be generalizable outside of Southeast Asia |
| Breastfeeding promotion | 25% (direct delivery); 40% (digital delivery) | Generalizability; possibility that digital tools are less well targeted to an at-risk population |
| Vitamin A | 41–88% | Child health/disease burden has improved since the trials; adjustment varies by country of implementation |
| Seasonal malaria chemoprevention | 69% (coverage & transmission intensity); 25% (generalizability) | Lower malaria transmission and program coverage than trial settings; drug less effective outside core Sahel region |
| Deworming | 79–99% (worm burden) | Worm prevalence and intensity far lower in target populations than in the 1998 Kenya trial; benefits decay over time; dosing differs from the trial |
Note. GiveWell (2020).
- I.e., benefits are a result of freed nursing time and improved ward care overall. ↑
- Specifically, heart and respiratory rates, blood oxygen saturation, blood pressure, and temperature. ↑
- Note that we do not interpret this as evidence that care definitively improved, but only that the intervention likely did cause changes in care provision. At the time of writing this report, we were not able to review the underlying analysis. ↑
- Only one unpublished abstract of a study in NICUs in Malawi (Chihana et al., 2026) used matched control hospitals as part of the evaluation of potential reductions in mortality. GOAL 3 informed us that full results are forthcoming. ↑
- The Hawthorne effect is the phenomenon where people change their behavior (often improving performance or compliance with an intervention) simply due to awareness that they are being studied, independent of any actual effect of the intervention itself. For IMPALA, this could be relevant since the monitoring technology is bundled with training and research attention, meaning any improvement in outcomes could partly reflect staff being more attentive and careful because they are being evaluated, rather than due to the monitoring device itself. ↑
- E.g., the central relative mortality reduction estimate for the NICU at Mchinji District Hospital is 35%, but the lower bound is 1%. ↑
- Note that GOAL 3 told us it tried adjusting for seasonality and for other time-varying contextual variables and that it did not improve the model fit. ↑
- We did not consider additional potential effects like nurse self-efficacy and work fulfillment, improved caregiver experiences, and provider acceptability because our analysis is only designed to capture quantifiable health impacts and costs. ↑
- At ZCH, the DALYs averted are decomposed into 7,130 years of life lost (YLL) and 235 years of life lived with disability (YLD); YLDs make up 3.2% of the total. At SLH, an estimated 1,081 YLL were averted, along with 39 YLD averted (YLD = 3.5% of the total). ↑
- In personal communication, GOAL 3 estimated this as $8,400–$10,920 per hospital per year, based on ~840 bed-days/hospital/year × WHO-CHOICE bed-day costs of $10–13. ↑
- Including 10 monitors, the IMPALA server hub with power backup, one central 24-inch monitoring screen for the ward, and one portable 10-inch tablet. ↑
- Including clinical support, a data dashboard, the Centralized Patient Overview, consumables including probes and sensors, and the subscription service package (IMPALA Care) detailed above. ↑
- This is an estimate based on similar products, not on evidence of failure rates; average lifetime of the product could be shorter or longer than GOAL 3 anticipates. ↑
- GOAL 3 estimates that the whole package could cost 20–30% less at scale (personal communication); this is accounted for in our sensitivity analysis (in the ‘High’ scenario). ↑
- Specifically, 5.6%–27.8% across four hospitals in Malawi (Chihana et al., 2026), 4.3–9.8% across two hospitals in Rwanda (Dine et al., 2025), and 12.7% in one hospital in Tanzania (GOAL 3 & Ifakara Health Institute, 2024, p. 10). ↑
- Published studies of neonatal mortality in NICUs in Malawi and Kenya estimate rates of 10–20%, with considerable variation across hospitals (e.g., Irimu et al., 2021, Murphy et al., 2018, and Mgusha et al., 2021), and some reaching >50% (de Visser et al., 2023). ↑
- We did not evaluate the pediatric HDU separately due to the overlap in population with the general pediatric ward. ↑
- We gave the effect sizes found in the Ben et al. (2026) hospitals (50% and 40% see lines 1 and 3 in Table 1) 45% of the total weight each and the effect size found in GOAL 3 & Ifakara Health Institute (2024) (11%, see line 6 in Table 1) 10% of the total weight. These are extremely rough and subjective weights designed to broadly indicate our confidence in the research design and subsequent analysis of the outcomes. ↑
- We gave each of the effect sizes found in GOAL 3 & Ifakara Health Institute (2024) (27%—see line 7 in Table 1) and Dine et al. (2025) (20% and −2% — see lines 8–9 in Table 1) a weight of 10% each. Like our weighted average for pediatric mortality reduction, these weights are only meant to broadly capture our interpretation of the reliability of the studies. ↑
- E.g., a lack of randomization, confounding, or a small sample size. ↑
- Note that this is a subjective assessment with no formal process of arriving at the values we use; others might reasonably arrive at different estimates. ↑
- Note that GiveWell is notably conservative in how it applies internal and external validity adjustments; even very strong evidence (like meta-analyses of randomized controlled trials) is given a 95% internal validity adjustment at maximum. ↑
- Like our internal validity discounts, this is a subjective assessment and we do not use a formal process to arrive at these numbers. ↑
- Though part of the annual subscription package includes additional support for staff, we are unsure to what extent this would replicate the conditions in which the evidence was generated. ↑
- Malawi, Rwanda, Tanzania, Kenya, Gabon, and Zimbabwe. ↑
- A WTP threshold broadly indicates the maximum a decision-maker would be prepared to pay for one additional unit of benefit (e.g., a DALY averted), reflecting the opportunity cost of displacing other interventions that the same money could have funded instead. From a traditional global health perspective, this has historically been set by the WHO’s framework of ~1-3x gross domestic product (GDP) per capita, but this has been criticized as too high in LMIC contexts (see Woods et al., 2016 and Ochalek et al., 2018). Instead, a threshold of ~50% GDP per capita or lower is suggested for low-income countries, which equates to ~$250–$600 for Malawi, Rwanda, and Tanzania. ↑
- We did not find any internal validity adjustments <5% in our brief review of GiveWell’s models. ↑