
How meat-free meal selection varies with menu options: an exploration
Non-technical summary
- We examined whether respondents selected more meat-free meals from certain types of menu, using data from an existing online hypothetical choice study (Brachem et al., 2019).
- Respondents selected more meat-free meals from hypothetical menus with more meat-free options and fewer fish/poultry options. But we didn’t find a strong association specifically for meat-analogue options.
- There are lots of important limitations to our analysis (e.g. not a randomized experiment; hypothetical choices – not actual behavior; meat-analogues in study not very appealing.)
- Despite these limitations, we think the results point to:
- the need for more research on the cost-effectiveness of advocating for meat-analogues compared to more meat-free options of any kind;
- the potential harm to animal welfare if food-service providers include more fish and poultry dishes on their menus.
Summary
- Increasing consumption of meat-free meals can help reduce demand for factory farmed animal products and anthropogenic greenhouse gas emissions. But relatively little research has been done on how meat-free meal selection is influenced by menu options, such as the availability of meat-analogue options or different types of meat.
- We conducted a preregistered reanalysis of data from a series of hypothetical discrete choice experiments from Brachem et al. (2019). We explored how meat-free meal selection by 1348 respondents (mostly German students) varied across 26 different menus, depending on the number of meat-free options and whether any options contained fish/poultry meat or meat-analogues. Menus consisted of five options (of which, two or three were meat-free) and were composed using images and descriptions of actual dishes available at restaurants at the University of Göttingen.
- While our work was motivated by causal hypotheses, our reanalysis was limited to detecting correlations and not causal effects. Specific limitations include:
- Examining hypotheses that the original study was not designed to evaluate.
- De facto observational design, despite blinded randomization in the original study.
- Possible non-random correlations between the presence of poultry/fish or meat-analogue menu options and the appealingness of other dishes.
- Analysis of self-reported, hypothetical meal preferences, rather than actual behavior.
- Meat-analogues in menus not reflecting prominent products attracting significant financial investment.
- Notwithstanding, our reanalysis found meat-free meal selection odds were:
- higher among menus with an extra meat-free option (odds ratio of 2.3, 90% CI [1.8 to 3.0]).
- lower among menus featuring poultry or fish options (odds ratio of 0.7, 90% CI [0.6 to 0.9]).
- not significantly associated with the presence of meat-analogues on a menu (odds ratio of 1.2 (90% CI [0.9 to 1.6])) in our preregistered meat-analogue definition. Estimates varied across analogue definitions, but were never significantly different from 1.
- Despite the many limitations, these findings might slightly update our beliefs to the extent we believe correlations would be expected if causation were occurring.
- The poultry/fish option correlation highlights the potential for welfare losses from substitution towards small-bodied animals from menu changes as well as shifts in consumer preferences.
- Given the study didn’t feature very prominent meat analogues, the absence of a correlation in this reanalysis cannot credibly be used to refute a belief that high-quality analogues play an important role in reducing meat consumption. But when coupled with the strong correlation on an additional meat-free option, we think the reanalysis highlights the need for further research on the most effective ways to encourage selection of meat-free meals. It remains an open question whether, at the margin, it would be more cost-effective to advocate for more menu options featuring meat-analogues specifically, or for more meat-free options of any kind.
Motivation
As many as 165bn land animals and finfish may be alive on farms at any moment (Animal Charity Evaluators, 2022).[1] More than 90% of these animals may be confined to life on factory farms (Anthis & Anthis, 2019). Animal farming is estimated to cause 14.5% of human-induced greenhouse gas emissions (Gerber at al., 2013).
Reducing meat consumption can reduce demand for the outputs of factory farms and support efforts to reduce anthropogenic greenhouse gas emissions. Understanding which interventions are most effective in reducing meat consumption is important. It can help avoid the risk that interventions inadvertently result in more animals suffering on factory farms, and ensure resources are allocated appropriately.
One specific risk that animal advocates are concerned about is known as the ‘small-bodied animal problem.’ This occurs if interventions result in consumers replacing foods from larger animals, (such as beef and pork) with foods from smaller animals (such as chicken, eggs, and fish), rather than plant-based foods.
Such substitution could result in more animals suffering. Calories from chicken or eggs are estimated to require 18 to 40 times as many days of animals living in factory farms as the same amount of calories from beef (Reese, 2018). Environmental nudges are suspected to be at risk of causing this type of substitution (Mathur, 2022). But there is relatively little research on which other interventions might also be susceptible, and the magnitude of the consequences.
On resource allocation, meat-analogues, such as plant-based meats and cultivated meats, have become a source of optimism for reducing meat-consumption, and have attracted significant investment (Peacock, forthcoming). A 2018 survey of 30 animal advocacy leaders and researchers ranked development of meat-analogues as their third highest priority, after only research and corporate outreach (Savoie, 2018). One advocate speculated that research and development into cultivated meat is “probably the most effective measure to reduce anthropogenic animal suffering” (Bruers, 2020). Crosser (2020, p.26) estimates that the plant-based foods industry at large attracted at least US$1.73 billion in investment activity in 2019, and US$23.75bn since 2020.
But the evidence on the impact of the availability of meat-analogues on animal-meat consumption to date is limited. Recent systematic reviews include only a small number of studies incorporating meat-analogues, often as part of broader interventions (Taufik et al., 2019; Bianchi et al., 2018; Grundy et al., 2022).[2]
While there is some evidence of falls in animal-meat consumption after the introduction of meat-analogues (for example in Malan, 2020), there is also some evidence that increasing the proportion of meat-free options offered on menus can reduce the selection of animal-meat based meals (Garnett et al., 2019; Pechey et al., 2022).
This reanalysis aims to better understand how meat-analogues might compare to other plant-based options in reducing animal product consumption, and explores the impact the availability of poultry/fish menu options could have on meat-free meal selection.
Methodology
Overview
This reanalysis uses data generated by Brachem et al. (2019), a hypothetical choice study examining the impact of short social norms messages on the selection of meat-free meals across a range of different menus.
Our reanalysis exploits variation in the menu options in the original study to explore correlations with meat-free meal selection. Characteristics of interest include the number of meat-free options, and the presence of options featuring poultry/fish or meat-analogues.
We registered our hypotheses, credences and analytical approach on the Open Science Framework website on November 23, 2022, before any analysis was carried out, other than reviewing meal descriptions to check there was sufficient menu variation across the trials. This reflects our belief that many of the benefits of preregistration (Nosek et al., 2018) also apply to secondary research.
Background on the original study
Brachem et al. (2019) consisted of two preregistered, randomized, blinded experiments (N1 =450, N2=899). In each experiment, subjects participated in a series of trials where they were asked to select a single meal (forced choice) from a menu of five options. Subjects were recruited from the University of Göttingen, and were mostly students. To proxy actual meal selection decisions made by students, each menu in the study was based on actual dishes available at the same time on menus at two university restaurants. A picture of each dish was presented, as well as some descriptive text in German, including a title, some explanatory text and combinations of letters and numbers referencing allergen information (see Figure 1).
The menus presented in each trial varied in terms of the number of meat-free options (usually two or three), the availability of meat-analogues among the meat-free options, and the types of animal meat among the meat-based options. Subjects participated in 29 trials in experiment one and 28 trials in experiment two. Of these, 26 trials contained exactly the same combination of dishes across both experiments.[3]
In the original study, subjects were presented with different messages as they were making their choices. These messages depended on the treatment group the subject was assigned. The messages either reflected social norms, attentional controls or were neutral/distractors, depending on the experiment and specific trial. Subjects were also asked questions about their environmental attitudes and how frequently they consumed meat after participating in the trials.
The authors found that subjects with greater concern for the environment were more likely to select meat-free meals, but found no significant effect arising from different types of messages. They also found a statistically significant association between the number of meat-free options and meat-free meal selection in an exploratory analysis of data from the first experiment.
Figure 1: Example menu from trial 11 in experiment one

Our reanalysis
Our reanalysis involved categorizing meals according to whether they contained poultry/fish meat or meat-analogues, selecting which trials and subjects to include, and then using statistical analysis to evaluate our hypotheses.
Registered hypotheses
H1. Meat-free meal selection will be higher among menus with a higher proportion of meat-free options. This will be statistically significant at an alpha of 5%.
H2. The presence of meat-analogues on a menu will be associated with a higher selection of meat-free meals by subjects, but this effect will not be statistically significant at an alpha of 5%.
H3. The presence of meats from small-bodied animals on a menu will be associated with a lower selection of meat-free meals by subjects. This will be statistically significant at an alpha of 5%.
Sub-hypotheses on odds ratios estimated from regression coefficients in our main statistical model are set out in Table 1 below, along with respective author credences.
Table 1: Sub-hypotheses and co-author credences
Hypothesis |
Odds ratio sub-hypothesis | Co-author credences | |
Sagar Shah | Jacob Peacock | ||
H1
Meat-free meal | H1a: Point estimate > 1 | 95% | 90% |
| H1b: Significantly >1 in a one-sided test with alpha of 5% | 90% | 80% | |
| H1c: Point estimate >1.5 | 90% | 75% | |
H2 Meat-analogue | H2a: Point estimate > 1 | 70% | 65% |
| H2b: Significantly >1 in a one-sided test with alpha of 5% | 30% | 60% | |
| H2c: Point estimate < 1.2 | 55% | 60% | |
H3
Small-bodied animal | H3a: Point estimate < 1 | 70% | 50% |
| H3b: Significantly < 1 in a one-sided test with alpha of 5% | 55% | 45% | |
| H3c: Point estimate < 0.65 | 50% | 35% | |
Meal categorization
Meat-based dishes were categorized using meal descriptors created by the authors of the original study. Dishes were coded as ‘small bodied’ if the authors described them as poultry or fish dishes, and ‘large-bodied’ if the authors described them as beef, pork or venison dishes.[4]
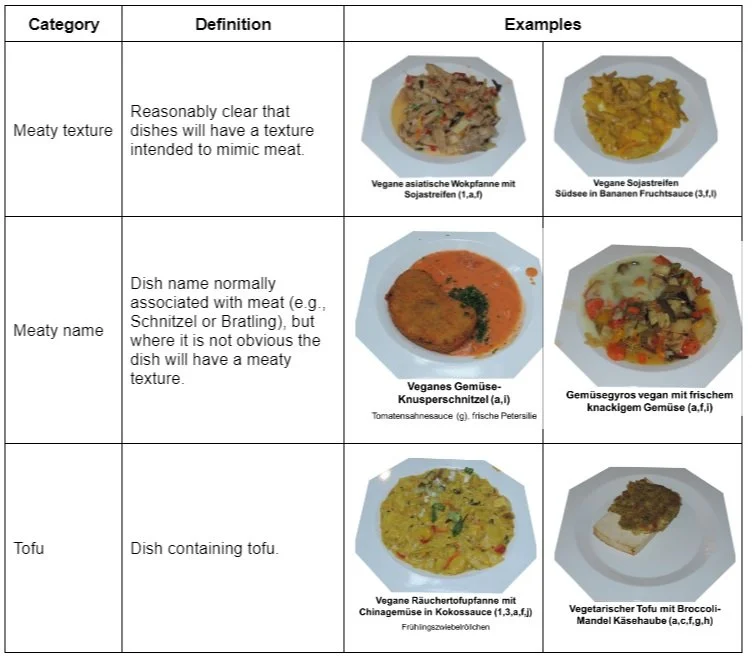
Categorizing meat-free dishes as analogues or non-analogues was challenging for two reasons. First, none of the dishes included in the original study very obviously characterized prominent meat-analogues (there were dishes featuring ‘soya strips’ but no burgers or sausages from prominent brands such as Beyond Meat or Impossible Foods, for example). Second, norms about what constitutes an ‘analogue’ may vary across cultures. Perceptions of German students (the study participants) may be different to Anglo-American researchers (the reanalysis co-authors).
Analogue categorization was completed with the assistance of a panel of German-speaking staff at Rethink Priorities. Our registered analogue definition was restricted to meat-free dishes where it would be reasonably clear to respondents from the images and descriptions that there would be a ‘meaty texture.’ But to test for sensitivity to how we had defined analogues, we also repeated analysis using wider definitions including ‘meaty names’ (for example, a vegetarian schnitzel appearing to be made from vegetables rather than mock-meat) and tofu-based dishes.
Table 2 below provides descriptions of the specific analogue definitions with examples of meal images and descriptions in German.
Table 2: Analogue categories and descriptions
Trial and subject selection
We limited analysis to the 26 trials featuring exactly the same meal composition across both experiments and pooled responses across both experiments.
We followed the original study’s approach to selecting eligible respondents,[5] and also excluded one additional subject who we identified as making invalid meal selections in three trials. This means a total of 35,048 observations were included in our reanalysis, consisting of 1348 subjects each making meal selections over 26 trials.
Main statistical model
We evaluated our hypotheses using the statistical model set out in the registration: a logistic mixed regression with crossed random intercepts for each subject and trial. This follows the approach conducted by authors of the original study in their exploratory analysis. Analysis was carried out in R Statistical Software (v4.2.2; R Core Team, 2022) using the glmer function of the lme4 package (Bates et al., 2015), using the equation below:
MF_meali,t = α + υi + ηt + MF_optiont + Analoguet + Small_animalt
Variables are described in Table 3 below.
Table 3: Variable descriptions
| MF_meali,t | Meat-free meal selection variable. Takes the value 1 if subject i selects a meat-free meal in trial t. Otherwise 0. |
| α | Base intercept. |
| υi | Random intercept for each subject i with variance 𝜏subject and mean 0. Seeks to capture differing propensities to consume meat-free meals across subjects that may be independent of trial composition. |
| ηt | Random intercept for each trial t with variance 𝜏trial and mean 0. Seeks to partially capture how the relative attractiveness of meat-free and meat-based dishes may vary across trials. |
| MF_optiont | Dummy variable taking the value of 1 if trial t included three meat-free options, or 0 if the trial included only two meat-free options. |
| Analoguet | Dummy variable taking the value of 1 if at least one of the meat-free options in trial t was identified as a meat-analogue. Otherwise 0. |
| Small_animalt | Dummy variable taking the value of 1 if at least one of the animal-meat based options in trial t was identified as poultry or fish by the original study authors. Otherwise 0. |
We did not include in our specification any variables relating to which experiment subjects participated in or what treatment condition they were assigned to. This reflected a desire to keep the scope of the reanalysis narrow. We felt comfortable doing this given the original study found very similar meat-free meal selection shares for trials with identical menu options across both experiments, and also found no statistically significant effect of differing messages. Random intercepts for each subject may also partially capture differences across individuals recruited to different experiments.
Robustness and sensitivity tests
We checked the sensitivity of the results from our main statistical model to different definitions of meat-analogue (including wider and narrower definitions). We also checked sensitivity to how we specified small-bodied animal options by testing the results with a numerical variable (with the number of options in a menu), rather than a dummy variable.
We also evaluated our hypotheses using two alternative statistical models: a logistic regression with individual fixed effects only (effectively a dummy variable for each subject) and a simple linear regression with the average share of meat-free meals per trial as the dependent variable and only 26 observations. These alternative models were motivated by concerns that the assumptions needed for multilevel models to generate consistent estimators might be violated (specifically, the orthogonality of random effects to regressors).
Table 4: Alternative statistical model specifications
| Model type | Specification |
| Logistic regression with individual fixed effects only (indi) | MF_meali,t = indi + MF_optiont + Analoguet + Small_animalt |
Linear regression on meat-free meal share per trial | MF_meal_sharet= α + MF_optiont + Analoguet + Small_animalt |
Descriptive statistics
Table 5 sets out the number of dishes included in our analysis (130 options featured across 26 menus) by category and sub-category. Approximately half of the dishes were meat-free. Of the meat-based dishes, around a fifth were categorized as fish or poultry. There were seven dishes categorized as a meat-analogue under our registered definition requiring a meaty texture, accounting for just over a tenth of meat-free dishes.
Table 5: Number of dishes by sub-category across 26 trials selected for analysis
| Category | Total | Subcategory | Total |
| Meat: small-bodied | 26 | Fish | 11 |
| Poultry | 15 | ||
| Meat: large-bodied | 40 | Beef | 9 |
| Pork | 27 | ||
| Venison | 4 | ||
| Meat-free | 64 | Analogue (texture) | 7 |
| Analogue (name) | 7 | ||
| Analogue (tofu) | 5 | ||
| Other meat-free | 45 | ||
Total | 130 | ||
Table 6 describes the proportion of total menu options and meal selections associated with each type of option among trials and subjects included in our reanalysis. Small-bodied meat options made up around a fifth of options and selections. Large-bodied meat options constituted just under a third of menu options, but only a fifth of selections. Meat-free options accounted for just under half of menu options and made up almost six in ten selections.
Table 6: Menu options and meal selections by option characteristics
Option category | Share of (%) | Differences | ||
Menu options | Meal selections | Absolute (pp) (Selections – options) | Ratio (%) (Selections/Options - 1) | |
| Fish | 8.5 | 7.3 | -1.2 | -13.9 |
| Poultry | 11.5 | 12.8 | 1.3 | 11.0 |
| Subtotal: small-bodied meat | 20.0 | 20.1 | 0.1 | 0.5 |
| Beef | 6.9 | 4.7 | -2.2 | -31.5 |
| Pork | 20.8 | 13.1 | -7.7 | -37.0 |
| Venison | 3.1 | 2.6 | -0.4 | -14.2 |
| Subtotal: large-bodied meat | 30.8 | 20.5 | -10.3 | -33.5 |
| Analogue (texture) | 5.4 | 5.5 | 0.1 | 1.9 |
| Analogue (name) | 5.4 | 5.6 | 0.2 | 4.4 |
| Analogue (tofu) | 3.8 | 3.3 | -0.5 | -13.0 |
| Other meat-free | 34.6 | 45.0 | 10.4 | 30.0 |
| Subtotal: meat-free | 49.2 | 59.4 | 10.2 | 20.8 |
| Total | 100.0 | 100.0 | n/a | n/a |
Table 7 describes how the number of options with selected dish characteristics was distributed across trials, and the average share of meat-free meals selected by participants among trials with these characteristics. The average share of meat-free meals was around 12pp higher among trials with three meat-free options than in those with two, and 12pp lower among trials with two fish/poultry options than those with none.
Table 8 describes how selection of meat-free meals varied across the 1348 subjects included in our reanalysis. Just under 20% of subjects selected a meat-free meal in all 26 trials, while 2% never selected a meat-free dish.
Table 7: Distribution of option categories across trials and average meat-free meal share
Option characteristic | Number of options in trial | Number of trials | Average meat-free meal share (%) |
Meat-free (any kind) | 2 | 14 | 53.9 |
3 | 12 | 66.0 | |
Fish/poultry | 0 | 8 | 64.2 |
1 | 10 | 61.8 | |
2 | 8 | 51.7 | |
Analogue (texture only) | 0 | 19 | 60.5 |
1 | 7 | 56.6 | |
Analogue (texture, name or tofu) | 0 | 8 | 59.7 |
1 | 17 | 60.2 | |
2 | 1 | 44.5 | |
Average across all trials | n/a | 26 | 59.5 |
Table 8: Distribution of meat-free meal selection by subject
Number of trials where a meat-free meal was selected | Number of subjects | Share of subjects (%) |
0 | 29 | 2.2 |
1 to 5 | 164 | 12.2 |
6 to 10 | 214 | 15.9 |
11 to 15 | 271 | 20.1 |
16 to 20 | 232 | 17.2 |
21 to 25 | 175 | 13 |
26 | 263 | 19.5 |
Total | 1348 | 100 |
Results
Main statistical model
Table 9 below illustrates the results of our registered statistical model. Subjects were more likely to select meat-free meals in trials which featured three rather than two meat-free meals (odds ratio of 2.3, 90% confidence interval of 1.8 to 3.0). Meat-free meal selection was lower among menus that featured a poultry/fish option (odds ratio of 0.7, 90% confidence interval of 0.6 to 0.9). Meat-free meal selection was on average higher in trials featuring an analogue, but this was not statistically significant (odds ratio of 1.2, 90% confidence interval of 0.9 to 1.6).
The estimated variance of the inter-subject random effect was high (𝜏 subject = 5.46), most likely due to the high proportion (c.20%) of subjects who selected a meat-free meal in every trial.
| Table 9: Multilevel model results with crossed random intercepts for each subject and trial | |||
| Dependent variable: Meat-free meal selection | |||
| Trial-constant characteristics | Odds Ratio | 90% Confidence Interval | p |
| Intercept | 1.92 | 1.44 – 2.56 | <0.001 |
| Extra meat-free option | 2.33 | 1.81 – 2.99 | <0.001 |
Poultry/fish option (dummy) | 0.72 | 0.56 – 0.93 | 0.035 |
Analogue option: texture only | 1.18 | 0.89 – 1.56 | 0.328 |
| Observations | 35048 | ||
| N trial | 26 | ||
| N subject | 1348 | ||
| ICC | 0.63 | ||
| Marginal R2 / Conditional R2 | 0.023 / 0.637 | ||
| AIC | 33763.847 | ||
Random effect variances [6]: 𝜏 trial = 0.12 & 𝜏 subject = 5.46
Robustness and sensitivity tests
Table 10 below presents the results from alternative statistical models and restricting the sample to exclude the subjects who either always or never selected a meat-free meal. Odds ratio estimates and confidence intervals for trial-constant characteristics of interest are very similar under the full sample and restricted sample multilevel models. Hypothesis resolution is also very similar under the linear model regressing average meat-free meal share per trial against trial-characteristics. Taken together, these results give us some comfort around the robustness of the findings of our registered model to alternative specifications.
| Table 10: Results from alternative statistical models | ||||
Trial-constant Characteristics
| Odds ratios (90% confidence interval) | Estimate (90% CI) | ||
Multilevel (full sample) | Multilevel (restricted sample) | Logistic with individual fixed effects (restricted sample) | Linear | |
| Intercept | 1.92 (1.44 – 2.56) | 0.86 (0.66 – 1.14) | 0.56 (0.52 – 0.61) | |
| Extra meat-free option | 2.33 (1.81 – 2.99) | 2.30 (1.79 – 2.96) | 2.34 (2.22 – 2.47) | 0.12 (0.08 – 0.16) |
Poultry/fish option (dummy) | 0.72 (0.56 – 0.93) | 0.72 (0.56 – 0.94) | 0.72 (0.68 – 0.76) | -0.05 (-0.09 – -0.00) |
| Analogue option: texture only | 1.18 (0.89 – 1.56) | 1.18 (0.89 – 1.56) | 1.19 (1.12 – 1.26) | 0.02 (-0.02 – 0.07) |
| Observations | 35048 | 27456 | 27456 | 26 |
| N trial | 26 | 26 | ||
| N subject | 1348 | 1056 | ||
| ICC | 0.63 | 0.35 | ||
| Marginal R2 / Conditional R2 | 0.023 / 0.637 | 0.038 / 0.379 | NA | 0.622 / 0.571 |
| AIC | 33763.847 | 31915.216 | 29066.371 | -72.107 |
| Random effect variances in restricted sample multilevel model : 𝜏 trial = 0.12 & 𝜏 subject = 1.69 | ||||
Odds ratio estimates under the logistic model with individual fixed effects (in essence, a separate intercept estimated for each subject) were also very similar to those from the mixed models, but with much narrower confidence intervals. This is most likely due to this specification treating meal selections by different subjects in a given trial as independent, when they would in fact be correlated. The failure of the model specification to take into account clustering across trials resulted in standard errors that are too low. We therefore chose to discount the results of this model, despite including it in the registration as a robustness test.
| Table 11: Multilevel model: sensitivity to poultry/fish option specification and analogue definition | |||||
Meaty texture (continuous poultry/fish variable) | Meaty texture (main model) | Meaty texture or name | Meaty texture or tofu | Any analogue | |
| Trial-constant characteristics | Odds Ratio (90% Confidence Interval) | ||||
| Intercept | 2.07 (1.54 – 2.79) | 1.92 (1.44 – 2.56) | 1.86 (1.40 – 2.49) | 2.29 (1.63 – 3.21) | 2.17 (1.50 – 3.14) |
| Extra meat-free option | 2.06 (1.58 – 2.69) | 2.33 (1.81 – 2.99) | 2.26 (1.79 – 2.85) | 2.11 (1.65 – 2.70) | 2.19 (1.73 – 2.78) |
Number of poultry/fish options | 0.78 (0.66 – 0.92) | ||||
Poultry/fish option (dummy) | 0.72 (0.56 – 0.93) | 0.72 (0.56 – 0.92) | 0.71 (0.54 – 0.92) | 0.72 (0.55 – 0.94) | |
Analogue option: texture only | 1.21 (0.92 – 1.59) | 1.18 (0.89 – 1.56) | |||
Analogue option: texture OR name | 1.21 (0.96 – 1.52) | ||||
Analogue option: texture OR tofu | 0.86 (0.68 – 1.10) | ||||
| Analogue option: any | 0.93 (0.72 – 1.21) | ||||
| Observations | 35048 | 35048 | 35048 | 35048 | 35048 |
| Marginal R2 / Conditional R2 | 0.023 / 0.637 | 0.023 / 0.637 | 0.023 / 0.637 | 0.023 / 0.637 | 0.022 / 0.637 |
| AIC | 33762.307 | 33763.847 | 33763.036 | 33763.830 | 33764.575 |
Table 11 shows the results of four sensitivity tests of our full-sample multilevel model to poultry/fish option specification and analogue definition.[6] The main results remain unchanged irrespective of whether poultry/fish options are included as a dummy or continuous variable. The magnitude and direction of odds ratio estimates for meat-analogues varies across different definitions but is never significantly different from one. Note that when the meat analogue definition features tofu (‘texture or tofu’ definition, or ‘any analogue’), the point estimate of the odds ratio is below one, suggesting lower meat-free meal selection among menus featuring tofu options.
Hypothesis resolution
Table 12 below describes the resolution of our sub-hypotheses. All three sub-hypotheses resolved favorably on H1 (the positive association between meat-free meal selection and an additional meat-free menu option). We assessed H3 (negative association between meat-free meal selection and fish/poultry menu options) as also resolving favorably overall. This is despite us rejecting sub-hypothesis H3c as the estimated odds ratio was higher than 0.65.
Table 12: Sub-hypotheses and co-author credences
Odds ratio Hypothesis |
Sub-hypothesis | Resolution | |
Resolved | Notes | ||
H1
Additional meat-free meal | H1a: Point estimate > 1 | In favor | |
| H1b: Significantly >1 in a one-sided test with alpha of 5% | In favor | ||
| H1c: Point estimate >1.5 | In favor | ||
H2 Meat-analogue | H2a: Point estimate > 1 | Mixed | Favorable in registered definition, but point estimates < 1 when definition included tofu. |
| H2b: Significantly >1 in a one-sided test with alpha of 5% | Rejected | ||
| H2c: Point estimate < 1.2 | Mixed | Favorable in registered definition, but point estimates >1.2 when definition included meat-free dishes with ‘meaty names’ | |
H3
Small-bodied animal | H3a: Point estimate < 1 | In favor | |
| H3b: Significantly < 1 in a one-sided test with alpha of 5% | In favor | ||
| H3c: Point estimate < 0.65 | Rejected | ||
Hypothesis 2 also resolved favorably overall. This is because, in our registered analogue definition, the presence of an analogue option was associated with higher meat-free meal selection, but this was not statistically significant in a one-sided test with an alpha of 5%. Resolution was however sensitive to the analogue definition. Sub-hypothesis H2a and hypothesis H2 overall would have been rejected had our registered analogue definition included tofu.
Study limitations
While our work was motivated by causal hypotheses, the inferences we can make from our reanalysis are limited because the study design means we could only detect correlations and not causal effects. Specific limitations are set out in Table 13 below.
Table 13: Study limitations
| Study not designed to evaluate our hypotheses | The original study was designed (and powered) to evaluate hypotheses relating to the impact of social norm messages and environmental attitudes, not the hypotheses we explored in our reanalysis. |
| De facto observational design | The original study involved blinded, randomized experiments with treatment and control groups. But our reanalysis effectively limited us to an observational study design. |
| Non-random menu variation | A key weakness in our reanalysis is that there could be non-random correlations between the presence of poultry/fish and meat-analogue options and the appealingness of other dishes. For example, if meat-based dishes happen to be much more appealing in menus which feature meat-analogues, it’s possible we could see lower meat-free meal selection on menus that feature meat-analogues, even if meat-analogues are on average more appealing than other meat-free dishes. |
| Hypothetical choice study | The data we reanalyzed is based on a hypothetical choice survey. This means it is based on self-reported preferences, rather than actual behavior. The latter is considered more reliable. |
| External validity | Participants in the study were mostly German students, female (68%) and had an average age of 24. Their preferences may not be reflective of those from other geographies or different demographic profiles. |
| Meat-analogues not reflective of recent investment | The meat-analogues that featured on the menus in the study weren’t necessarily reflective of some of the high-profile products that have attracted significant investment in recent years (for example, there were no burgers or sausages from Beyond Meat or Impossible Foods). This means it is hard to be confident if any findings from this study will also apply to high-profile analogues. |
Discussion
Despite the many limitations, these findings might slightly update our beliefs to the extent we believe correlations would be expected if causation were occurring.
The poultry/fish option correlation adds a potential data point to the small-bodied animal problem. It highlights the potential for welfare losses from menu changes as well as shifts in consumer preferences.
Given the study didn’t feature very prominent meat analogues, the absence of a correlation in this reanalysis cannot credibly be used to refute a belief that high-quality analogues play an important role in reducing meat consumption. But when coupled with the strong correlation on an additional meat-free option, we think the reanalysis highlights the need for further research on the most effective ways to encourage selection of meat-free meals.
It remains an open question whether, at the margin, it would be more cost-effective to advocate for more menu options featuring meat-analogues specifically, or for more meat-free options of any kind.
Acknowledgements

This research is a project of Rethink Priorities – a think tank dedicated to informing decisions made by high-impact organizations and funders across various cause areas.
The authors are Sagar Shah and Jacob Peacock. Jacob conceptualized and oversaw the project. Sagar developed the methodology, conducted analysis and drafted the registration and final report.
Thanks to Johannes Brachem and David Reinstein for helpful comments, Samara Mendez for advice on the statistical methodology, Ben Stevenson for reviewing code, Neil Dullaghan and Jenny Kudymowa for assistance categorizing analogues, and Adam Papineau for copyediting.
Code (https://osf.io/fwtxk/) and study pre-registration (https://osf.io/g5twd) available via Open Science Framework.
If you are interested in RP’s work, please visit our research database and subscribe to our newsletter.
References
Animal Charity Evaluators. (2022, March). Consideration of Cause Areas. https://perma.cc/5VKPRHKS.
Anthis, Kelly & Anthis, Jacy Reese. “Global Farmed & Factory Farmed Animals Estimates”. Sentience Institute. February 2019. https://perma.cc/S7LW-RVMB
Bates, D., Mächler, M., Bolker, B., & Walker, S. (2015). Fitting linear mixed-effects models using lme4. Journal of Statistical Software, 67(1). https://doi.org/10.18637/jss.v067.i01
Bianchi, F., Dorsel, C., Garnett, E., Aveyard, P., & Jebb, S. A. (2018). Interventions targeting conscious determinants of human behaviour to reduce the demand for meat: a systematic review with qualitative comparative analysis. International Journal of Behavioral Nutrition and Physical Activity, 15(1). https://doi.org/10.1186/s12966-018-0729-6
Brachem, J., Krüdewagen, H., & Hagmayer, Y. (2019). The Limits of Nudging: Can Descriptive Social Norms be Used to Reduce Meat Consumption? It's Probably Not That Easy. https://doi.org/10.31234/osf.io/xk58q
Bruers, S. (2020, August 10). “The Extreme Cost-Effectiveness of Cell-Based Meat R&D.” Effective Altruism Forum. https://perma.cc/CZ6N-55QQ.
Crosser, N. (2020). 2019 U.S. State of the Industry Report: Plant-Based Meat, Eggs, and Dairy. The Good Food Institute. https://perma.cc/5SXT-BWWL.
Garnett, E. E., Balmford, A., Sandbrook, C., Pilling, M. A., & Marteau, T. M. (2019). Impact of increasing vegetarian availability on meal selection and sales in cafeterias. Proceedings of the National Academy of Sciences, 116, 201907207. https://doi.org/10.1073/pnas.1907207116
Gerber, P. J., Steinfeld, H., Henderson, B., Mottet, A., Opio, C., Dijkman, J., Falcucci, A. & Tempio, G. (2013). Tackling climate change through livestock: a global assessment of emissions and mitigation opportunities. Food and Agriculture Organization of the United Nations (FAO). https://perma.cc/A5R8-G2ZK
Grundy, E. A. C., Slattery, P., Saeri, A. K., Watkins, K., Houlden, T., Farr, N., Askin, H., Lee, J., Mintoft-Jones, A., Cyna, S., Dziegielewski, A., Gelber, R., Rowe, A., Mathur, M. B., Timmons, S., Zhao, K., Wilks, M., Peacock, J. R., Harris, J., & Rosenfeld, D. L. (2022). Interventions that influence animal-product consumption: A meta-review. Future Foods, 5, 100111. https://doi.org/10.1016/j.fufo.2021.100111
Lüdecke, D. (2022). sjPlot: Data Visualization for Statistics in Social Science. R package version 2.8.12. https://CRAN.R-project.org/package=sjPlot.
Malan, H. J. (2020). Swap the Meat, Save the Planet: A Community-Based Participatory Approach to Promoting Healthy, Sustainable Food in a University Setting. [Doctoral dissertation, UCLA] Escholarship.org. https://escholarship.org/uc/item/3pq4t2mz
Mathur, M. B. (2022). Ethical drawbacks of sustainable meat choices. Science, 375(6587), 1362–1362. https://doi.org/10.1126/science.abo2535
Nosek, B. A., Ebersole, C. R., DeHaven, A. C., & Mellor, D. T. (2018). The preregistration revolution. Proceedings of the National Academy of Sciences, 115(11), 2600–2606. https://doi.org/10.1073/pnas.1708274114
Peacock, J. (forthcoming). Selling Competitive Plant-Based Meat Might Not Be Enough. Rethink Priorities.
Pechey, R., Bateman, P., Cook, B., & Jebb, S. A. (2022). Impact of increasing the relative availability of meat-free options on food selection: two natural field experiments and an online randomised trial. International Journal of Behavioral Nutrition and Physical Activity, 19(1). https://doi.org/10.1186/s12966-021-01239-z
R Core Team. (2022). R: A language and environment for statistical computing. R Foundation for Statistical Computing, Vienna, Austria. https://www.R-project.org/.
Reese, J. (2018). The end of animal farming : how scientists, entrepreneurs, and activists are building an animal-free food system. Beacon Press.
Romero Waldhorn, D., & Autric, E. (2022, December 21). Shrimp production: Understanding the scope of the problem. https://doi.org/10.31219/osf.io/b8n3t.
Savoie, J. (2018, August 27). “How to Make an Impact in Animal Advocacy, a Survey.” Effective Altruism Forum. https://perma.cc/9ZE9-8L5A
Stammann, A., Heiss, F., & McFadden, D. (2016). Estimating Fixed Effects Logit Models with Large Panel Data. VfS Annual Conference 2016 (Augsburg): Demographic Change 145837, Verein für Socialpolitik / German Economic Association. https://EconPapers.repec.org/RePEc:zbw:vfsc16:145837
Taufik, D., Verain, M. C. D., Bouwman, E. P., & Reinders, M. J. (2019). Determinants of real-life behavioural interventions to stimulate more plant-based and less animal-based diets: A systematic review. Trends in Food Science & Technology, 93, 281–303. https://doi.org/10.1016/j.tifs.2019.09.019
Wickham, H., Averick, M., Bryan, J., Chang, W., McGowan, L., François, R., Grolemund, G., Hayes, A., Henry, L., Hester, J., Kuhn, M., Pedersen, T., Miller, E., Bache, S., Müller, K., Ooms, J., Robinson, D., Seidel, D., Spinu, V., & Takahashi, K. (2019). Welcome to the Tidyverse. Journal of Open Source Software, 4(43), 1686. https://doi.org/10.21105/joss.01686
Notes
- ^
In addition, there may be as many as 230bn shrimp and 85bn insects alive on farms at any moment (Romero Waldhorn & Autric, 2022).
- ^
Much of the material on resource allocation was adapted from Peacock (forthcoming).
- ^
The order of presentation varied across the two experiments, both in terms of the order of dishes within trials consisting of the same dishes, and the order in which subjects faced these trials.
- ^
One dish was a pork steak topped with tuna and cheese. This was categorized as a pork dish rather than a fish dish, as pork was the main ingredient.
- ^
See page 14 and 25 of Brachem et al. (2019).
- ^
Random effect variances and intraclass correlation coefficients (ICC) are not reported in Table 10, but were very similar (within 0.01) to the main model results across all specifications.