
Better weather forecasting: Agricultural and non-agricultural benefits in low- and lower-middle-income countries
Editorial note
This report is a “shallow” investigation, as described here, and was commissioned by Open Philanthropy and produced by Rethink Priorities. Open Philanthropy does not necessarily endorse our conclusions.
The primary focus of the report was to investigate whether improving weather forecasting could have benefits for agriculture in low- and lower-middle income countries, and evaluate how cost-effective this might be. Note that this means we did not evaluate improvements in weather forecasting against other potential interventions to achieve the same aims, such as the development of climate-resilient crops.
We reviewed the academic and gray literature, and also spoke to seven experts. In our report, we provide a brief description of weather forecasting and the global industry, before evaluating which farmers might most benefit from improved forecasts. We then explore how predictions are currently made in countries of interest, and how accurate they are. We evaluate the cost-effectiveness of one intervention that was often mentioned by experts, and highlight other potential opportunities for grantmaking and further research.
We don’t intend this report to be Rethink Priorities’ final word on this topic and we have tried to flag major sources of uncertainty in the report. We are open to revising our views as more information is uncovered.
Key takeaways
- Weather forecasting consists of three stages. [more]
- Data assimilation: to understand the current state of the atmosphere, based on observations from satellites and surface-based stations. All forecasts beyond 4-5 days require global observations.
- Forecasting: to model how the atmosphere will change over time. Limits to supercomputing power necessitates tradeoffs, e.g., between forecast length and resolution.
- Communication: packaging relevant information and sharing this with potential users.
- The global annual spending on weather forecasting is over $50 billion. [more]
- Around 260-305 million smallholder farms in South Asia, sub-Saharan Africa and Southeast Asia stand to benefit the most. [more]
- A wide range of farming decisions benefit from weather forecasts, from strategic seasonal or annual decisions like crop choice, to day-to-day decisions like irrigation timing.
- There is some evidence that farmers can benefit from forecasts in terms of increased yields and income.
- For smallholder farmers, cereals are likely the most important crop group, constituting 90% of their agricultural output.
- Medium-range and seasonal forecasts of rainfall and temperature are most important to these farmers.
- In the lower-middle-income countries and low-income countries1 of interest, weather forecasting quality remains poor. [more]
- Global numerical weather prediction (NWP) is a methodology that underlies much of weather forecasting. Seasonal forecasts of temperature seem more accurate than those for precipitation. At shorter timescales, forecasts in the tropics may be useful with a lead time of up to two weeks, and are generally less accurate than forecasts for the mid-latitudes.
- Public sector forecasting in these LMICs is generally informed by global NWPs, meaning that accuracy and resolution remain low.
- LMICs do not improve on global NWPs, as they lack resources and access to raw data.
- We have not found any evidence to suggest that private sector forecasts are better, though Ignitia’s approach targets one of the main issues with global NWPs.
- Global numerical weather prediction (NWP) is a methodology that underlies much of weather forecasting. Seasonal forecasts of temperature seem more accurate than those for precipitation. At shorter timescales, forecasts in the tropics may be useful with a lead time of up to two weeks, and are generally less accurate than forecasts for the mid-latitudes.
- A small sample of public and private organizations we reviewed spends about $300 million each year on improving forecasting. [more]
- It’s likely that advisories are needed, especially for seasonal forecasts. [more]
- Improving weather forecasting would also have ~0.75x non-agricultural benefits for LMICs. On top of this, there could be additional DALY benefits from improving disaster risk management. [more]
- We identified twelve potential interventions (captured in a table here), and discuss four of these in our report.
- Our estimate of the cost-effectiveness of funding additional observation stations suggests that this does not cross the Open Philanthropy bar (16x-162x versus a threshold of 1,000x). [more]
- Funding research to identify times and places where global NWPs are already performing well could have benefits, and we estimate the costs of a potential research program to be ~$1 million. [more]
- We also outline two potential tactical grants: extending access to the S2S database, and digitizing paper records from observation stations. [more]
- We conclude that those pursuing further research on this topic with the aim of identifying the most cost-effective intervention in this area may benefit from focusing on:
- identifying areas where global NWPs are already accurate enough to provide value for agriculture and working to make these accessible and useful to farmers
- forecasts with shorter lead times. [more]
Weather forecasting 101
Weather forecasting can be broken down as follows (loosely based on Met Office, n.d.-b):
- Getting the current state of the atmosphere (data assimilation) based on:
- direct observations from satellites and surface-based observation stations
- expected conditions for locations where observations do not exist
- Calculating how the atmosphere will change (forecasting) using fluid dynamics equations to model how the air will move and result in specific weather conditions.
- Communicating forecasts to users
Data assimilation
To make a prediction about any location beyond four to five days into the future, it is necessary to have global observations of the atmosphere (Kull et al., 2021, p. 10). The World Meteorological Organization (WMO) facilitates this by requiring that countries and satellites contribute observations from more than 10,000 sources to the WMO Information System, which is then shared with the National Meteorological and Hydrological Services (NMHS) in every country (WMO, 2022c). Weather forecasting is highly data-intensive; for example, the European Centre for Medium-Range Weather Forecasting (ECMWF) receives 800 million observations per day (ECMWF, n.d.-c).
Forecasting
This process is highly technical, and running complex equations to capture the physical processes in the atmosphere (e.g., radiation, convection) requires significant computing power (ECMWF, n.d.-a). Limits to supercomputing require tradeoffs between desirable outcomes: incorporating more observations of the atmosphere, forecasting over longer timescales, modeling with smaller grid resolution (ECMWF, n.d.-e). According to our conversation with Douglas Parker at the UK National Centre for Atmospheric Science, NMHS may engage in post-processing to improve the resolution of model outputs using a method known as downscaling, or improve the accuracy of the model by correcting for known biases.
Communication to users
After forecasting, the relevant information needs to be packaged into a format that is accessible to potential users, and shared.
Total global spending on weather forecasting is over $50 billion
[Confidence: high.]
The most comprehensive recent estimate by Georgeson et al. (2017) suggests that total (public and private) global spending on “weather and climate information services” (WCIS) was more than $56 billion in 2014/2015 (p. 2).
While we do not have a detailed breakdown of this funding, it is interesting to note that:
- According to Rogers and Tsirkunov (2013), global public spending in 2013 was $15 billion, which suggests that most spending in this area is private (p. 1).
- According to the WMO (2020b), the global observation system (including satellites, surface-based observing systems, and support for global numerical weather predictions [NWPs] is estimated to cost $10 billion (p. 8). It’s likely that this is a mix of private and public spending.
Regions and farmers that would benefit the most
Farmers make a wide range of decisions that depend on the weather, and forecasts can lead to increased yields and income
[Confidence: high confidence that farmers make decisions that depend on weather information. Moderately high confidence that there is a positive relationship between forecasts and income.]
For any farmer, there are a large number of decision points throughout a season that are impacted by weather information. For example, expectations about rainfall could affect long-term strategic decisions like what crops to grow for the coming season, or day-to-day decisions about when to apply fertilizer or weedicide.2 These decisions have a direct impact on the yield of the crops planted, and the costs that farmers incur each season.
The theory of change for this report rests on the idea that weather forecasts are a classic public good, and although overall spending is high, forecasts are unlikely to be optimized for farmers in low- and lower-middle income countries. As such, these farmers make suboptimal decisions in conditions of uncertainty. If the forecasts were better, this would allow for more informed decision-making, leading to higher incomes.
We found a number of studies that looked into the effects of weather forecasting on agriculture. Our review was non-exhaustive, but in general we found that the studies suggest positive impacts on income and yield:
- Vaughan et al. (2019) reviewed the literature on ex-post and ex-ante impacts of agricultural weather and climate services in sub-Saharan Africa. They found
yield increases ranging from roughly 9% to 66%, though in some cases farmers experienced losses compared to the control group. Benefits were higher for wealthier farmers with more land and fertilizer.
- The authors also aggregate six documents to estimate that a majority (74%) of farmers in Africa with access to weather forecasts actually use them (pp. 6-8). They further report that 11 studies indicate a majority — and three studies a minority — of farmers in various African countries who access weather forecasts factor the information obtained into various agricultural management decisions (pp. 32-33).
- Kull et al. (2021) briefly reviewed some literature on agricultural benefits and estimated that:
- 5%-10% of national agricultural yield losses are due to weather variability (Food and Agriculture Organization [FAO], 2019)
- The availability and use of weather forecasts can reduce these agricultural losses by 10%-30% in various countries such as Peru, Ethiopia, Mexico, Kenya, the Philippines, and the USA (e.g., Rathore & Chattopadhyay, 2016; Meza et al., 2008)
- Rosenzweig and Udry (2019) conducted a time-series analysis that suggests that correctly forecasting the monsoon onset in India could increase farmers’ incomes by around $365 million, assuming farmers trust and react to forecasts. This represents just under 0.1% of India’s total agricultural GDP of $376 billion.
- A 2018 independent evaluation of Ignitia in Ghana found in a farmer survey that farmers who started using Ignitia’s SMS weather prediction service saw a mean annual increase of $476 and a median increase of $168 (Securing Water for Food, 2018).3 Ghana’s GNI per capita is $2,360, though some farmers likely have much lower incomes than this (Wageningen University & Research, 2021).
The scope of this report is such that we focus on improving forecasts for farmers who already have access to this information, rather than increasing the number of farmers with access. Briefly reviewing some of the information available about access in low- and lower-middle-income countries, Vaughan et al. (2019) suggest that these are highly variable across studies, ranging between 5% and 82% across West and East Africa, though these results are likely somewhat out of date (p. 7).4 There are organizations, such as Precision Development (PxD), who are working to make sure forecasts are available to more farmers. We have not reviewed these as part of this work, but are aware that GiveWell has evaluated PxD before (GiveWell, 2022).
Around 260 million-305 million smallholder farms in South Asia, sub-Saharan Africa, and Southeast Asia stand to benefit most
[Confidence: moderate confidence on the focus on smallholder farmers. Some additional uncertainty around farmer responses to forecasts, as well as the details of the intervention. High confidence on the regions that benefit most — conditional on smallholder farms being the most important beneficiaries, it is unlikely that additional research will change our views on the most important regions.]
The total addressable market may include all smallholder farms, which is estimated to be around 390 million-480 million farms under 2 ha, and constitute 24% of total agricultural land and 32% of the world’s food supply (Ritchie & Roser, 2021; Ritchie, 2021).5
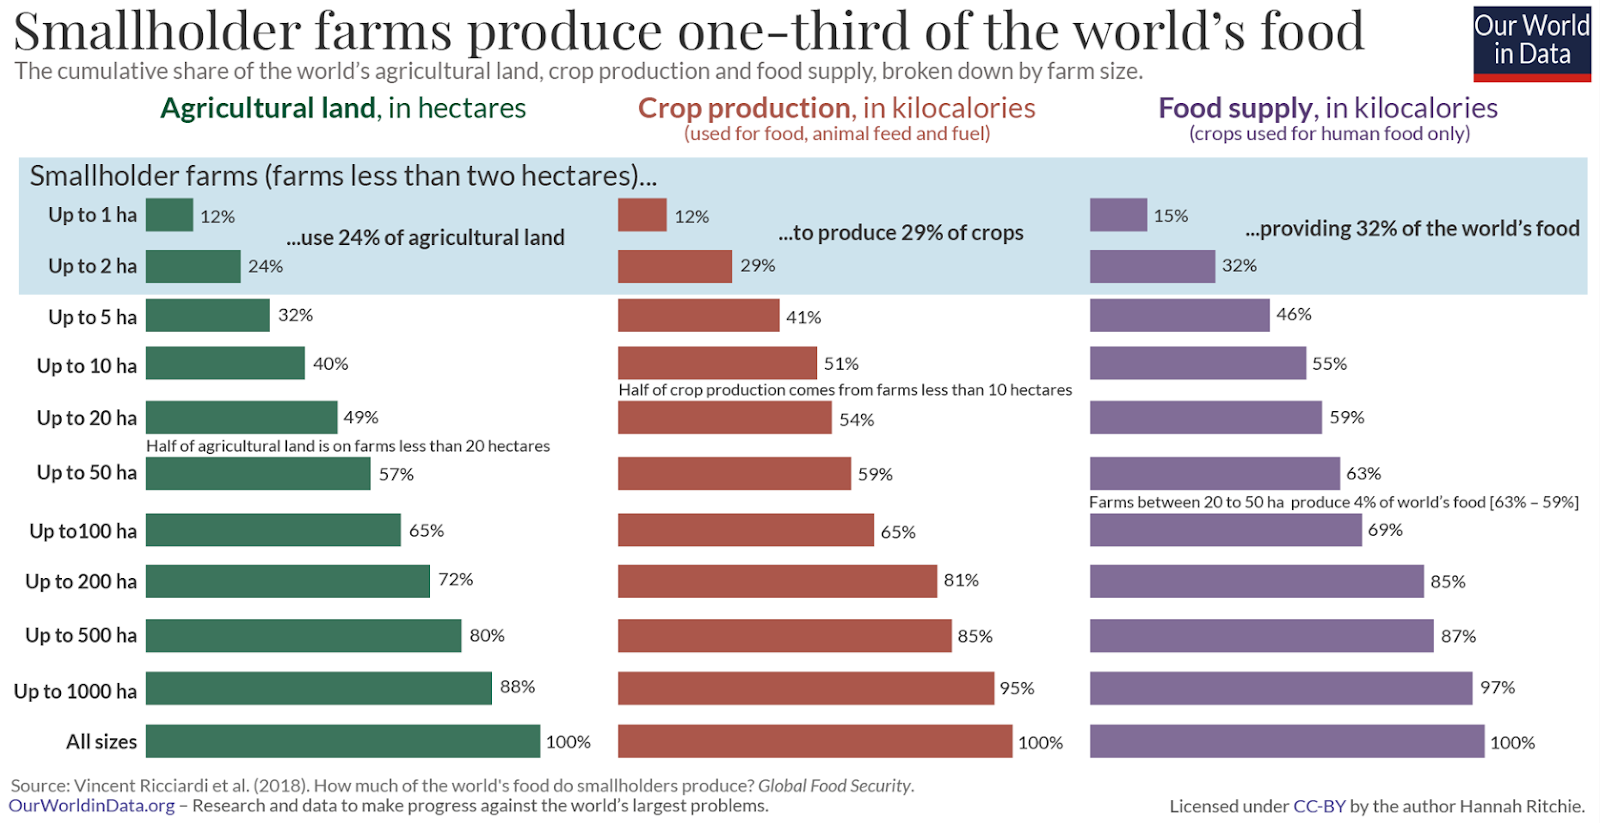
We chose to focus on smallholder farms due to higher relative income benefits for poorer farmers and poorer countries. Additionally, farm size is a major determinant of food self-sufficiency, potentially opening up additional paths to impact to be explored, such as food security and malnutrition (Ricciardi et al., 2018).
- We considered investigating larger farms, as richer farmers may be better equipped to respond to weather forecasts, due to the availability of better agronomic technologies (Iizumi & Ramankutty, 2015), higher disposable income, or better farming practices.
- Similarly, if communication/dissemination of weather forecasting and corresponding farming best practices ends up being very costly, this may prompt us towards exploring larger farms, as each farmer reached would likely lead to more absolute gains. However, this is unlikely to be the case — GiveWell gives an estimate of the cost per farmer of PxD’s dissemination at “$1.80 per household per year, or $0.27 per person” (GiveWell, 2020). We have not checked this carefully.
- Ultimately, we thought that these were unlikely to change our focus, as comparatively low-cost responses such as changing the timing of harvest or fertilizer would be possible in many smallholder farms. Additionally, the considerations about costly communication and dissemination of information seemed relevant to a narrower set of interventions and contexts, compared to the higher marginal utility of increasing income.
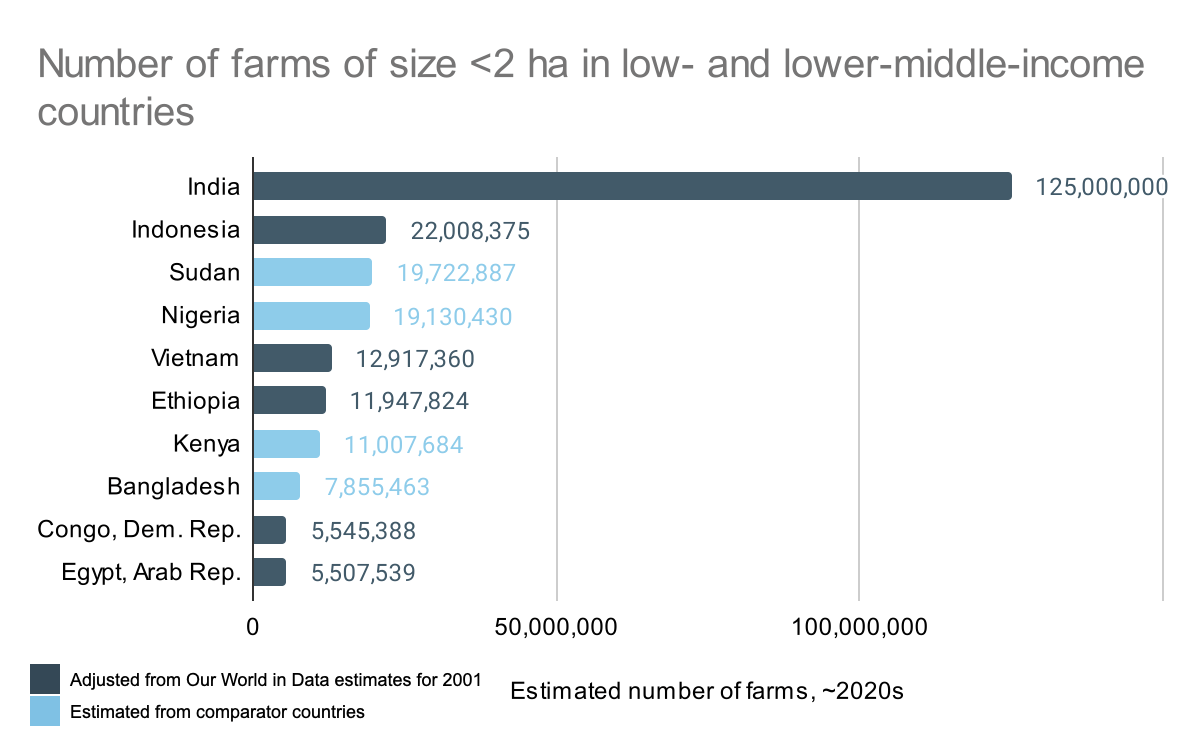
We estimate there are (very) roughly 260 million-305 million farms under 2 ha in low- and lower-middle income countries of interest. The vast majority of these farms are in South Asia, sub-Saharan Africa, and Southeast Asia. Assuming five household members per farm, this would suggest roughly 1.3 billion-1.5 billion people.6 If we scale our estimate for farms under 2 ha to include farms up to 5 ha and 10 ha, this number could be up to 357 million or 372 million farms respectively, or roughly 1.8 billion people.7 We have low confidence in our estimates, particularly for farms under 5 ha or 10 ha. Our methodology can be found in Appendix C.
Cereals are likely the most important crop group, constituting 90% of agricultural output in smallholder farms
[Confidence: high. Unlikely that additional research will change our views on the most important crops. Note that this does not take into account the extent to which farmers have the knowledge, resources and market access to respond to forecasts without additional investment beyond improving weather forecasting, which is a key uncertainty for this report.]
Our assessment of which crops are most important focused on two elements: what kinds of crops are most often grown by smallholder farmers, and how sensitive we expect these crops will be to improved forecasts.
Cereals dominate in terms of outputs for smallholder farms, constituting 90% of their agricultural output in terms of calories (Ritchie & Roser, 2021). This is especially important for subsistence farmers who often do not make enough to reinvest. In their review study, Meza et al. (2008) evaluate the expected value of forecast information (EVOI) of various crops, based on ex-ante assessments. Their analysis finds that cereals have relatively low EVOI compared to other crops. We asked Paul Winters and Imara Salas about why cereals dominate and why they might have low EVOI, and they indicated that smallholder and subsistence farmers grow low-yield varieties of cereals that are less weather sensitive as part of a “safety first” mentality.
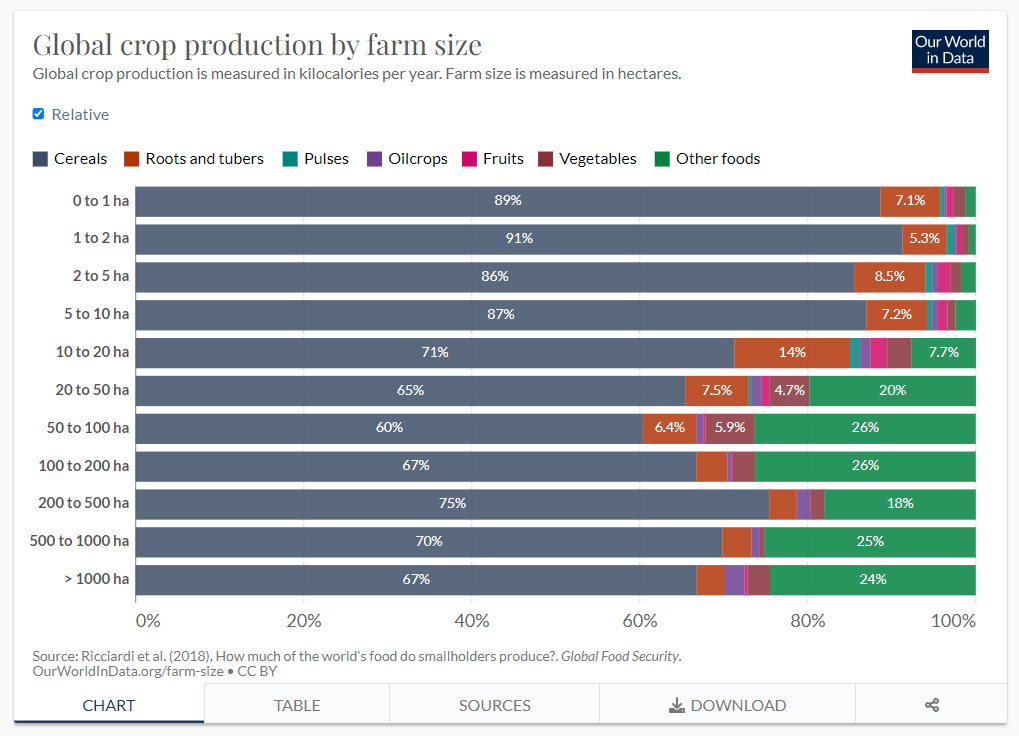
When taking into account both yield and EVOI, the only comparable other crops are potatoes and tomatoes, which have EVOIs of up to two orders of magnitude above cereals according to Meza et al. (2008, pp. 1276-1279, Table 1). However, the EVOI values are based largely on data from the Americas (with minor contributions from Australia, and a single entry from the Philippines). Additionally, due to the high agricultural output of cereals, we remain confident that cereals are likely to be key crops for smallholder farmers.
We also considered cash crops (crops that are planted with the goal of being sold for profit) as potentially important, as smallholder farmers might switch away from cereals to improve incomes. We initially looked into crops with the highest global total production value, which added soybeans, sugarcane, grapes, and cotton to the list. This was partially corroborated by our interview with Nabansu Chattopadhyay, who suggested sugarcane, cotton, and grapes as the most important cash crops in India. There are other cases of farmers switching from cereals to cash crops due to environmental reasons, for example, Australian farmers switching from rice to grapes due to a combination of drought and the high water requirements of rice (Bradsher, 2008). On the other hand, soybeans and grapes are largely produced by richer countries, so this may be a reason to put less emphasis on these two crops. We have not thoroughly investigated the extent to which cash crops may be comparable to cereals.
Medium-range and seasonal forecasts of rainfall and temperature are most important to these farmers
[Confidence: moderately high. Unlikely that additional research will change our views on the common crops/regions in LMICs, but this may change if we focus on different crops or specific regions.]
Farmers typically need a combination of weather information, ranging from historic and contemporaneous observations to predictions from daily to seasonal and longer-term forecasts (Tall et al., 2012, p. 15).8
There are reasons to suggest that, on average:
- Rainfall and temperature are the most important for farmers, e.g.:
- According to FAO (2019):
- “The two most important elements are temperature and water availability” (p. 4); “The most useful weather forecast information that can assist farmers in making decisions on agricultural management is the early indication of the characteristics of the rainy season” (p. 68).
- Medium-range or subseasonal (10-30 days) and seasonal9 (three to six months) forecasts are more important than short-range (one to three days) forecasts for farmers, e.g.:
- According to Bacci et al. (2020), “Short-term weather forecasts, one up to three days, as usually provided by met services, are not sufficient to take some strategic decisions on crop management planning and risk reduction strategies, which require 10 days to seasonal lead times” (p. 2).
- Ouédraogo et al. (2015) found that farmers in Burkina Faso have a higher willingness to pay for seasonal information (~$15) than 10-day information (~$4) or agrometeorological advisories (~$6).10
- The vast majority of literature we found on the benefits of weather forecasting for farmers focused exclusively on or emphasized seasonal forecasts (e.g., Meza et al., 2008; Roncoli, 2006; Rosenzweig & Udry, 2019). We spoke to Chris Udry, who confirmed that this focus reflected his view of the importance of seasonal forecasts.
- According to FAO (2019):
In the LMICs of interest, weather forecasting quality remains poor
Global NWPs show limited accuracy for seasonal forecasts, and at shorter timescales they are less accurate for the tropics than the mid-latitudes
[Confidence: medium confidence regarding specific regions/timescales with accuracy; these are unlikely to change with additional existing research, but further expert input could lead to updates. High confidence that with shorter lead time, global NWPs are worse for tropics than mid-latitudes.]
Global NWP models form the basis of much of the international weather forecasting system. Such forecasts are created by 12-15 NMHSes, predominantly in Western and East Asian countries (Kull et al., 2021, p. 10).
Our reading suggests that forecast accuracy can vary depending on location and time of year. Large-scale atmospheric patterns — such as jet streams, or oscillations like El Niño — are significant determinants of the weather. According to de Andrade et al. (2021) and Stacey et al. (2019), the key large-scale patterns for subseasonal and seasonal weather in South Asia and sub-Saharan Africa are the El Niño Southern Oscillation, Madden-Julian Oscillation, and Indian Ocean Dipole. As such, if a global NWP was good at modeling one of these patterns, then during the times of year when the weather in a particular area was primarily determined by this driver, we would expect that the forecast would perform well. Where/when multiple drivers were at play, the forecast would be less good.
We spent five hours searching for and reviewing academic publications that evaluate global NWP forecasts against actual weather conditions in the LMICs of interest, focusing on subseasonal or seasonal forecasts of precipitation or temperature.
Assessments of seasonal forecasts (three to six months lead time) appear to be scarce. In our search we found only two resources, which both evaluate ECMWF hindcasts with a lead time of two to four months.
- Weisheimer and Palmer (2014) construct a “reliability” measure to assess forecasts of temperature and precipitation globally at two points each year. For our regions of interest, they conclude that the level of reliability achieved is such that temperature forecasts are likely to be useful (with some limitations during colder summers in western SSA), while precipitation forecasts will likely be only “marginally useful” for much of the year.11
- The ECMWF evaluates its own seasonal forecasts and publishes the results.12 While we did not have the time or technical expertise to review all of these in detail, we briefly considered the results for the anomaly correlation coefficient (ACC; Owens & Hewson, 2018, Section 6.4). For this measure, a higher value is better and 0.6 is the threshold below which a forecast is not useful (versus simply taking an average). Comparing the relevant charts, forecasts for precipitation appear not to provide additional information beyond a simple average for many LMICs (ACC < 0.6) while temperature forecasts seem to be more accurate. However, in both cases this is limited to certain times of year and in certain locations.13 Precipitation forecasts are particularly variable, with much better performance in East Africa and Southeast Asia than in other regions.
We hold these impressions with medium confidence, as our literature review was not exhaustive, and further review by a technical expert could easily update these conclusions.
We also found that global NWPs are generally perceived to be worse at predicting weather for tropical environments than for the mid-latitudes (Youds et al., 2021, p. 19). We did not find any evaluations that allow us to interrogate this claim for (sub)seasonal forecasts, but found evidence of this for shorter lead times. Figure 4 below shows that the ECMWF’s model accurately predicts the temperature in non-tropical Northern Hemisphere climates 4.5 days in advance, but for the tropics this level of accuracy is not achieved until 1.5 days before.14

According to the literature, the main reasons for this are:
- it is particularly difficult to forecast for the convective storms that prevail in tropical climates (Youds et al., 2021, p. 10), and
- there is a relative lack of observations for these regions (Kull et al., 2021, p. 27; Youds et al., 2021, p. 25), due to lower density of stations and higher rates of non-reporting due to issues such as lack of maintenance (Fink et al., 2011).
Public sector forecasting in these LMICs seems to be informed by global NWPs, meaning that accuracy and resolution remain low
[Confidence: moderately high. Further desk research is unlikely to change the conclusions, but additional calls with NMHS staff from key countries could lead to higher confidence or identify exceptions.]
Our understanding is that most forecasting by NMHS in the LMICs of interest is directly informed by the outputs of global NWPs. Our confidence in this conclusion varies with regions and timescales, as shown in Table A2 in Appendix A.
Our impression from speaking with Douglas Parker, who works closely with the UK Met Office, is that HICs would generally engage in post-processing (e.g., downscaling and correcting for biases) before producing weather bulletins, or run a separate, more geographically focused model for short-range forecasts. It’s not clear that these steps are taken in LMICs.
As a result, we would expect that forecasts in LMICs have similar levels of accuracy as global NWPs, as detailed above. There is some research that suggests that the seasonal forecasts created by Regional Climate Outlook Forums — where experts may look at a number of forecasts and then decide a “consensus” option (WMO, n.d.-a) — may actually be less accurate, for example, by showing biases towards “near normal” conditions (Walker et al., 2019, Bliefernicht et al., 2019) or demonstrating low skill (Laux, 2017). We have not reviewed these papers in enough detail to form a confident opinion on this.
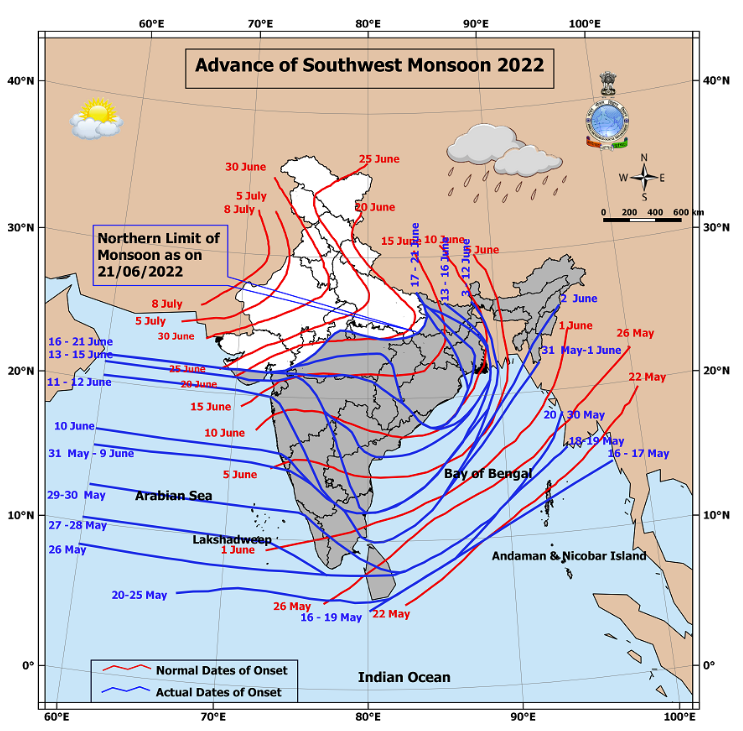
It is also worth noting that aside from issues with accuracy, when looking at the products that appear to be available for LMICs, subseasonal and seasonal weather information is communicated with low resolution, such that they are unlikely to be useful to smallholder farmers who want to know what will happen on their small number of hectares. For examples, see the IGAD Climate Prediction and Applications Centre (ICPAC) seasonal rainfall forecast for the Horn of Africa (Figure 5) and the India Meteorological Department (IMD) forecast of monsoon onset (Figure 6) below.15 It is not clear to us whether this is linked to the underlying resolution of seasonal forecast data, and it may be worth investigating further.

LMICs do not improve on global NWPs, as they lack resources and access to raw data
[Confidence: moderately high that this captures two significant reasons. Less confident that we have captured all reasons.]
Funding for weather forecasting in LMICs is very low relative to that in HICs. For example, the US National Weather Service requested a budget of $1.12 billion in FY 2021 (National Oceanic and Atmospheric Administration [NOAA], 2020) — or $33.70 per capita — while the Indian Meteorological Department budget is approximately $67 million for 2022, or $0.50 per capita (Express News Service, 2022). Figure 7 below from Georgeson et al. (2017) suggests a slightly smaller per capita difference (~$30 per capita in North America versus ~$2.50 per capita in sub-Saharan Africa and South Asia) but the discrepancy is still very large.

There are also human resource gaps. According to a white paper by the Global Challenges Research Fund African Science for Weather Information and Forecasting Techniques (GCFR African SWIFT) project, a joint venture between NMHSes and researchers in the UK and West Africa:
-
African weather services are aware that they mostly lack the state-of-the-art facilities for these functions, and lack the human capacity and in some cases, capability, to update and maintain their systems (WMO, 2015). Basic expertise in computational methods and data handling is a key area in which capacity needs to be built. …
Another immediate priority for the advancement of African forecasting services is to build local capacity to undertake co-production of new services with users. … This capability implies the ability to manipulate NWP and satellite data, demanding core technical skills in programming, data handling, and computational systems. (Youds et al., 2021, p. 22)
In an interview, Kamoru Lawal stressed that for LMICs to effectively use global NWP data to produce useful forecasts, this will require access to raw outputs from these models rather than pre-programmed systems or graphics (see also Youds et al., 2021, p. 22). At present, the ECMWF Subseasonal to Seasonal (S2S) project represents a step forward in this kind of data sharing, prompting a variety of research projects including the provision of key subseasonal weather information to 56,000 farmers in Nigeria (ECMWF, n.d.-d; see also GCFR African SWIFT, 2021).16 However, the S2S program ended in October 2022. In discussion with Douglas Parker, he suggested that after the trial period NMHSes now have to pay an annual charge to access the forecasts. This helps to cover associated costs of producing and sharing the S2S forecasts, such as the storage and transfer of large amounts of data.17
We have not found any evidence to suggest that private sector forecasts are better, though Ignitia’s approach targets one of the main issues with global NWPs
[Confidence: moderately high that additional desk research will not reveal evidence to suggest private forecasts are better, and that these organizations rely on global NWPs to some extent.]
Private organizations such as the Weather Channel or AccuWeather provide forecasts for locations all around the world, at higher resolution and on longer timeframes than the public sector. For example, 90-day forecasts are available from Accuweather for locations throughout sub-Saharan Africa and South Asia. However, while we did not find any evaluation of the quality of private weather forecasting in LMICs, meteorologists have expressed significant concerns about Accuweather’s long-range forecasts (see, e.g., Cappucci, 2020, in the Washington Post).
While private organizations do not share the details of how they make their predictions, we expect that they are primarily derived from global NWP outputs that are either free — like the US National Center for Environmental Protection (NCEP) — or available to purchase — like ECMWF outputs. We hold this view with medium confidence, given the description on the AccuWeather site (AccuWeather, n.d.). We expect that these organizations do more post-processing than LMIC NMHSes, but it is unclear that these would be enough to significantly improve the accuracy of the forecasts. As such, it seems likely that these models suffer from similar weaknesses as outlined above.
One exception to this may be Ignitia (see Box 1 below), a private organization that uses satellite observations as inputs and runs its own model, which it aims to optimize for the convective processes that affect weather in sub-Saharan Africa (Ignitia, n.d.-b). In doing so, they directly address one of the main methodological shortcomings of global NWPs. While Ignitia claims that its results are 84% accurate — in comparison to 39% accuracy for global NWPs — independent evaluation has found that this is extremely misleading (International Research Institute for Climate and Society, 2017).18 The same evaluation also suggests that Ignitia’s model is more reliable than the NCEP global NWP outputs, but the evaluation cannot determine whether it is better than other private organizations, e.g., Weather.com, due to lack of data from these organizations. It does not make any comparison to other global NWP outputs or NMHS forecasts.
Box: Ignitia
As of mid-2021, more than 1.9 million small-scale farmers had subscribed to Iska (Kalu, 2021a). The company's two financing rounds in 2018 and 2021, totaling $5.6 million, saw investment by Novastar Ventures, IKEA Social Entrepreneurship, Future Foodways, Mercy Corps, Norrsken Foundation, FINCA Ventures, and Hack VC (Ainooson, 2018; Kalu, 2021a). In 2021, Ignitia also received a $1.5 million grant from Development Innovation Ventures to expand its ongoing work and conduct a randomized controlled trial in Ghana in conjunction with Innovations for Poverty Action (USAID, n.d.).
A small sample of public and private organizations we reviewed spends about $300 million each year on improving forecasting
[Confidence: moderately high that it is at least this much, and that interest has been increasing in recent years.]
We spent two working days compiling a list of organizations working on improving various aspects of weather forecasting, along with information on their focus and their spending.19 This list is not exhaustive, but rather illustrative, and it doesn’t lend itself to calculating total annual spending on forecasting. However, for a sense of scale, our convenience sample of organizations spend in the region of ~$300 million annually.
Almost all organizations we found were launched in the last 10-20 years. Our general impression is that the interest in weather and climate forecasting has been increasing in recent years.20 Most organizations aim to improve weather forecasting for various economic sectors, while some focus specifically on disaster warning or agriculture.
We found that public organizations tend to be somewhat more focused on increasing the number of observation stations, ensuring better data sharing among actors, and improving modeling, while private organizations tend to be more focused on better modeling and packaging/communication of forecasts.
It’s likely that advisories are needed, especially for seasonal forecasts
[Confidence: moderately high. Additional research and expert input might identify locations or crops where this would be unnecessary, or pieces of information smallholder farmers are equipped to respond to without advisories].
We have not found any published studies that quantify the relative benefits of weather forecasts vs. additional advisories. However, based on a brief review of the literature and our expert interviews with Paul Winters, Imara Salas, Nabansu Chattopadhyay, and Chris Udry, we hold the opinion that advisories are not strictly necessary, but generally beneficial and desired by farmers. We expect that this is particularly true for seasonal or longer-range forecasts, as unlocking the full benefit of the forecast may be linked to farmers adopting new agricultural techniques or crops, such that advice and training is needed.
The (nonexhaustive) relevant information that we have found on this topic is:
- According to farmer surveys and willingness-to-pay studies, farmers prefer advisory services in addition to weather forecasts, e.g.:
- Farmers in Burkina Faso have a willingness to pay for agromet advisories (~$6) in addition to 10-day (~$4) and seasonal forecasts (~$15; Ouédraogo et al., 2015),
- Farmers in Africa and South Asia prefer advice on how to use weather forecasts in their farming decisions (e.g., Identifying Good Practice in the Provision of Climate Services for Farmers in Africa and South Asia, 2012, p. 42; Walker, 2020, p. 3), and
- Sesame farmers in Ethiopia prefer easy-to-understand messages, as concepts like “degree celsius” are not always well-understood (Van Pelt, 2017).
- According to case studies, advisories are especially beneficial for seasonal or longer-range forecasts, as decisions become more context- and farmer-specific and more complex to communicate and interpret (e.g., Tall et al., 2012, p. 16; Van der Burgt et al., 2018, p. 8).
- Ignitia claims “no farmer training required” (Ignitia, n.d.-b); a 2018 independent evaluation of Ignitia’s forecasts for farmers in Ghana found income increases of $480 based on simple weather information such as “tomorrow, likely to rain” in a household survey (Securing Water for Food, 2018). We are uncertain about this figure for reasons explored in Appendix B.
- Training helps farmers understand and use probabilistic forecasts and speeds up the learning process according to a literature review on climate forecasting in sub-Saharan Africa (Hansen et al., 2010, p. 224).
We also found two sources that may be helpful for further research, though the results are not yet available and/or studies are ongoing. Their focus is also on short-range forecasts, and therefore results may be limitedly generalizable to longer-range forecasts:
- PxD’s survey of cotton farmers in Pakistan who participated in A/B testing of weather advisories (Tamming & Sadiq, 2022)
- A randomized controlled trial in Kenya studying the impact of providing agro-weather advisories by SMS, with and without training (Feed the Future, n.d.)
Our estimate is that additional non-agricultural benefits in LMICs could be of similar magnitude to agricultural, before counting DALYs
The best discussion of the agricultural and non-agricultural benefits of weather forecasting that we found was written by Kull et al. (2021) as a collaboration between the World Bank, the WMO, and the UK Met Office.
- They estimated the global socioeconomic value of weather forecasting for agriculture and a number of highly weather-sensitive sectors (disaster management, water supply, energy, transportation, construction).
- They estimated the total global annual benefits to be $162 billion, with a ratio of approximately 5:1 for non-agricultural to agricultural benefits. The largest source of benefit, $66 billion, was attributed to disaster risk management.
We recreated their calculations in this spreadsheet (see the “Kull et al. (2021)” tab). We then produced an updated estimate of nonagricultural benefits (see the “RP LMIC Estimate, 2022” tab), by:
- Breaking down Kull et al.’s (2021) estimates to specifically attribute benefits to LMICs. For simplicity, we include all such countries, rather than focusing specifically on the countries where the ~260 million smallholder farmers are found.
- Investigating the $66 billion benefits from disaster risk management, and reducing this to $13 billion. On considering the underlying assumptions, we felt that the basis for ~$48 billion of the $66 billion (73%) was not substantial enough to stand, and ~$3 billion (5%) involved double-counting.21
Our estimate suggests that in LMICs, combined non-agricultural benefits across a number of other weather-sensitive sectors are likely to be 0.75x the direct benefits to agriculture (including larger farms, and livestock, forestry and fishery). This estimate is not precise, but it seems likely that the benefit lies between 0.5 and 1.5x. Based on our calculations, it seems that in LMICs there is no single other sector that would provide the same benefits as agriculture, but given the lack of precision in our estimate, this is a weakly held conclusion.22
In addition, it seems likely that improving weather forecasts could provide some benefit in terms of disability-adjusted life years (DALYs), particularly by informing early warning systems and disaster risk management. We did not have the capacity to investigate this in detail, but brief research into this topic suggests that weather-related disasters have a large impact, and providing warnings can reduce the damage. For example, the Emergency Events Database (EM-DAT) suggests weather-related events affect ~180 million people and cause ~35,000 deaths globally each year (Centre for Research on the Epidemiology of Disasters, 2023), and the Global Commission on Adaptation (2019) suggests that a 24-hour advance warning of an incoming storm or heatwave can reduce damage by 30%.23 However, the ability to provide such warnings in LMICs remains limited. According to the WMO (2022b), one-third of the world’s population remains uncovered by early warning systems, and this is worse in Africa where 60% of people are uncovered. This suggests that a potentially large DALYs impact of better weather forecasts leading to better warnings may currently be limited by the absence of such systems in LMICs.
Analysis suggests funding additional observations would not be cost-effective, but other interventions may still be of interest
During our research, we identified 12 potential interventions, which we captured in a table here alongside partial information on costs, neglectedness, and our first pass thoughts.
We decided to focus the bulk of our analysis on whether funding additional observations would be a cost-effective way of improving weather forecasts. Our choice was informed by the opinions of the experts we spoke to, our priors, and the fact that information on costs and benefits was more readily available.
Our report also highlights three other options that we found interesting, though we did not have time to conduct cost-effectiveness analysis: an opportunity for additional research, and two low-cost opportunities (see here). Note that we have written up these ideas because we felt it would be helpful to share what we knew about them, rather than holding strong opinions that they are better than the other eight options that are included in the table but not mentioned in the body of our report.
Cost-effectiveness analysis of funding additional observations
One way to improve forecasts would be to collect more data. This approach has been highlighted by the WMO and World Bank, who propose to expand the Global Basic Observing Network (GBON) by adding more surface-based and upper-air (e.g., balloon) observations. Kull et al. (2021) show that observations added in poorly covered, remote locations are relatively more “valuable” to global NWPs, given the dearth of other information. Kull et al. (2021) estimate that the benefit of fully expanding GBON in all countries is $5.2 billion. We do not have high levels of confidence in this figure, as we cannot access the methodology or calculations.
WMO analysis identifies a persistent gap in small island developing states (SIDS) and least developed countries (LDCs), in which “about 2000 stations need to be rehabilitated or newly installed” to reach the target of 2,300 (WMO, 2020a, p. 1). This gap exists due to shortfalls in both financing and capacity. To support countries to fill this gap, the Systematic Observations Financing Facility (SOFF) has been established. They maintain that “the continued lack of surface-based observations in many parts of the world is currently the primary bottleneck limiting further improvements in NWP skill, and that addressing this problem would result in immediate benefits” (SOFF, 2021, p. 10).
The SOFF project is laid out as a 10-year endeavor, beginning with a three-year ‘first implementation phase’ that will involve scoping out the need in 55 countries, and then rehabilitating/installing 200-400 stations in 28 countries. The estimated cost of the first implementation phase is $200 million, of which 60% is already committed — mainly for the installation or initial repair of stations. For more detail, see the Terms of Reference (SOFF, 2021).
Our assessment of the cost-effectiveness of SOFF can be found in this spreadsheet. We have calculated both upper and lower bounds, given significant uncertainties about a number of relevant variables. Our rough estimate suggests that funding SOFF does not pass the OP bar with an estimated cost-effectiveness of 16x-162x.24
However, note that we do not incorporate any DALYs or well-being effects.
Additional research to understand where forecasts are already performing well
In an interview, Douglas Parker highlighted the need for more evaluation of global NWPs, to identify times and places where the forecasts may already be fairly accurate — and be honest about areas where they do not and may not be fit for purpose. He suggested that some geographies, such as coastlines, might naturally have higher accuracy. As discussed above (see here), our research does suggest that the forecast skill of NWPs is variable across geography and at different times of year, even within the tropical regions of interest to us.25 In particular, the ECMWF verification charts suggest that seasonal forecasts may be better for East Africa and Southeast Asia.
Knowing where and when forecasts work well could facilitate and guide efforts by other organizations such as PxD, making them more effective. This knowledge could also help others working to improve weather forecasting to focus on specific areas.
We were not able to calculate a useful measure of cost-effectiveness for this option, given a number of uncertainties and limited research time. However, it seems plausible that if an evaluation successfully identifies areas where the forecast is highly skilled, this information could be used to direct existing organizations, such as PxD, to work in these areas. As such, we have calculated a measure of rough costs and an estimate of the possible number of beneficiaries.
We estimated the costs of a research project in this spreadsheet, with the following assumptions:
- The evaluation would cover seven countries. This includes all countries on the shortlist for GiveWell’s scoping grant to PxD (India, Pakistan, Nigeria, Ethiopia and Kenya), and other countries where PxD operates that are within the scope of the report (Uganda and Bangladesh).
- The research would require a team of five researchers (or FTE). We expect that with set-up time, the project would exist for 1.5 years.
- The project would only evaluate ECMWF global NWP forecasts, given our low confidence conclusion (above) that existing research finds these to be better than others. The project would need to fund access to relevant data, both from the ECMWF and direct observations from countries of interest.
- There would be some overhead costs.
Our overall estimate of the costs is ~$1 million, with the majority of this spent on salaries. Our 90% confidence interval (assuming the same scope) is between $0.7 million and $1.5 million. As a sense-check, in 2016, NOAA in the US awarded $6.7 million to 14 projects working to evaluate S2S data (Climate Program Office, 2016). This works out to roughly $0.5 million per project, and at a brief glance it seems the projects were generally for three years but with fewer staff, so our estimate is likely in the right ballpark.
Based on our lower-bound estimates (above), these seven countries account for 164 million of the 260 million smallholder farms that would most benefit from weather forecasts.
A further extension to this project might add the following countries:
- Ghana: Ignitia operates here, and it might be interesting to make a direct comparison. This research may also have some overlap with West Nigeria.
- Rwanda: PxD has an existing program, and this research may be a natural extension from evaluating Uganda.
Smaller grant-making opportunities
In the course of our research, we also identified some low-cost potential observations that might be of interest. To describe these briefly:
- Extending access to the S2S database: As mentioned above (see here), the S2S program had been providing subseasonal data to LMICs but ended in October 2022. This brought a halt to related activities, such as the work Kamoru Lawal is doing with the African Center of Meteorological Application for Development (ACMAD) in order to share two-week forecasts with NMHSes across Africa (see here).26 Our best estimate of the costs of extending access for one year is $30,000-$60,000.27 The costs to access a smaller number of data fields needed for specific projections is likely to be <$5,000.28
- Digitizing paper records from observation stations: Doing so could make key observations from remote areas available to researchers to use to evaluate and improve global NWPs (Youds et al., 2021, p. 26). Improving these forecasting methods would have a “trickle-down” effect to those NMHSes in LMICs that are dependent on NWPs. Both Douglas Parker and Kamoru Lawal confirmed by email that such records are very common across Africa, including recent observations that have been captured by hand due to a combination of unreliable power supply and lack of computer literacy and hardware. While there are ongoing efforts to digitize these records — see for example the International Data Rescue (I-DARE)’s list of projects (I-DARE, n.d.) — our impression is that they are relatively slow, and there may be an opportunity to significantly speed up this process by directing a small amount of funds towards this task. Volunteer efforts may be an effective option, as with the UK’s Rainfall Rescue Project (Met Office, 2022). We have not estimated likely costs.
Conclusion
Our findings suggest that in LMICs, agriculture is an important weather-sensitive sector. We estimate that there are 1.3 billion-1.5 billion people in smallholder farms that could benefit from improvements in weather forecasting. Despite high levels of spending overall (> $50 billion per year), we found that there was comparatively little philanthropic spending to improve weather forecasting for those in LMICs (~$300 million per year) and NMHSes were generally less well funded than in HICs.
In our research, we chose to focus on subseasonal and seasonal forecasts on the basis that these would be most valuable to farmers, if available. We learned that these longer-term forecasts require global observations and modeling. As such, improving the accuracy of subseasonal and seasonal weather forecasting for LMICs is likely to require a focus on global NWPs, and our impression is that it would be difficult to target benefits specifically on LMICs. As a result, it seems less likely that interventions will meet the OP bar for cost-effectiveness.
Those pursuing further research on this topic with the aim of identifying the most cost-effective intervention in this area may benefit from focusing on:
- identifying areas where global NWPs are already accurate enough to provide value for agriculture (as outlined above), and working to make these accessible and useful to farmers, e.g., by downscaling to provide better resolution
- forecasts with shorter lead times.
This report primarily focused on agricultural benefits to LMICs. While our analysis of Kull et al. (2021) suggests that most other non-agricultural benefits will be smaller, it seems plausible that improving forecasts to inform early warning systems could potentially avert many DALYs, especially in LMICs that are at risk from weather-related disasters and are covered in early warning systems. This may be a productive area of further research.
What we would do with more time
- Investigate why weather forecast accuracy for temperate regions improved over time, as shown in Figure 4
- Research the relative difficulty of forecasting in SSA versus other tropical areas, such as Brazil/Singapore
- Better understand crop varieties, particularly with regards to how expected yield varies with weather dependency
- Investigate the value of technical solutions to improve forecast resolution, e.g., downscaling
- Estimate the impact of improving weather forecasting on disaster risk management, and the expected DALYs impact
- Read Barrett et al. (2020) on the value of local climate and weather information
Contributions and acknowledgments

Aisling Leow, Bruce Tsai, and Jenny Kudymowa researched and wrote this report. Aisling also acted as the project lead. James Hu edited the client-facing version of the report to transform it into a public-facing report. Tom Hird supervised and reviewed the report. Thanks to Marcus A. Davis for helpful comments on drafts. Further thanks to Alex Cohen (GiveWell), Christopher Udry (Northwestern University), Douglas Parker (UK National Centre for Atmospheric Science, University of Leeds), Imara Salas (Development Innovation Lab, University of Chicago), Kamoru Lawal (Nigerian Meteorological Agency), Nabansu Chattopadhyay (India Meteorological Department), and Paul Winters (University of Notre Dame) for taking the time to speak with us. Open Philanthropy provided funding for this project, but it does not necessarily endorse our conclusions.
If you are interested in Rethink Priorities' work, please consider subscribing to our newsletter. You can explore our completed public work here.
References
AccuWeather. (n.d.). Weather matters. Retrieved November 25, 2022, from https://corporate.accuweather.com/company/weather-matters/, archived at https://perma.cc/W5GJ-PDRX
African Centre of Meteorological Applications for Development. (2022a). Daily precipitation accumulations (mm) [Map]. https://web.csag.uct.ac.za/~lawal/Newfiles/ACMAD/S2S_Forecasts/20221031/ECMWF_Files/Africa_PrecipitationDaily_20221110.gif, archived at https://perma.cc/5P5A-J6X3
African Centre of Meteorological Applications for Development. (2022b). Ensemble prediction system: Nigeria Bauchi (a) [Graph]. https://web.csag.uct.ac.za/~lawal/Newfiles/ACMAD/S2S_Forecasts/20221031/ECMWF_Files/Nigeria_BAUCHI_20221031_A.gif, archived at https://perma.cc/D9R9-QSVN
African Centre of Meteorological Applications for Development. (2022c). Ensemble prediction system: Nigeria Bauchi (b) [Graph]. https://web.csag.uct.ac.za/~lawal/Newfiles/ACMAD/S2S_Forecasts/20221031/ECMWF_Files/Nigeria_BAUCHI_20221031_B.gif, archived at https://perma.cc/Y4DH-Z7NJ
African Centre of Meteorological Applications for Development & Intra-ACP Climate Services and related Applications Programme. (2022). Seasonal temperature forecast for June-July-August 2022 [Map]. http://154.66.220.45:8080/thredds/fileServer/ACMAD/PROJECTS/CLIMSA/CDD/ACTIVITIES/SERVICES/Doc_Web/imagetn1.jpg, archived at https://perma.cc/H4VZ-VCLA
Ainooson, E. (2018, November 2). Press release: Ignitia closes investment round with three major investors. Ignitia. https://www.ignitia.se/post/press-release-ignitia-closes-investment-round-with-three-major-investors, archived at https://perma.cc/X5MP-9YEJ
AMEA. (2021). Agricultural technology guide for advancing professional farmer organizations. https://amea-global.com/wp-content/uploads/2021/12/amea-tech-guide-2021-final.pdf, archived at https://perma.cc/93P4-EMTH
Bacci, M., Ousman Baoua, Y., & Tarchiani, V. (2020). Agrometeorological forecast for smallholder farmers: A powerful tool for weather-informed crops management in the Sahel. Sustainability, 12(8), 3246. https://doi.org/10.3390/su12083246
Bazley, T. (2016, February 13). In the internet age, radio still rules the world. https://www.aljazeera.com/news/2016/2/13/in-the-internet-age-radio-still-rules-the-world, archived at https://perma.cc/4AHC-PFH9
Bliefernicht, J., Waongo, M., Salack, S., Seidel, J., Laux, P., & Kunstmann, H. (2019). Quality and value of seasonal precipitation forecasts issued by the West African regional climate outlook forum. Journal of Applied Meteorology and Climatology, 58(3), 621–642. https://doi.org/10.1175/JAMC-D-18-0066.1
Bradsher, K. (2008, April 17). A drought in Australia, a global shortage of rice. The New York Times. https://www.nytimes.com/2008/04/17/business/worldbusiness/17warm.html, archived at https://perma.cc/LSN6-PJH3
Cappucci, M. (2020, January 13). How accurate were AccuWeather’s 30- to 60-day highly specific forecasts made for the holidays? The Washington Post. https://www.washingtonpost.com/weather/2020/01/13/how-accurate-were-accuweathers-30-60-day-highly-specific-forecasts-made-holidays/, archived at https://perma.cc/3QY7-XDD4
Centre for Research on the Epidemiology of Disasters. (2023). EM-DAT, the international disaster database. Université catholique de Louvain. https://public.emdat.be/, archived at https://perma.cc/FHH3-CHNH
Chevuturi, A., Turner, A. G., Johnson, S., Weisheimer, A., Shonk, J. K. P., Stockdale, T. N., & Senan, R. (2021). Forecast skill of the Indian monsoon and its onset in the ECMWF seasonal forecasting system 5 (SEAS5). Climate Dynamics, 56(9), 2941–2957. https://doi.org/10.1007/s00382-020-05624-5
Climate Program Office. (2016, October 3). Advancing the prediction of subseasonal to seasonal phenomena. National Oceanic and Atmospheric Administration, United States Department of Commerce. https://cpo.noaa.gov/News/News-Article/ArtMID/6226/ArticleID/818/Advancing-the-Prediction-of-Subseasonal-to-Seasonal-Phenomena, archived at https://perma.cc/7DUX-EJQC
Consultative Group to Assist the Poor. (2017, November). Understanding the demand for financial, agricultural, and digital solutions from smallholder households: Insights from the household survey in Nigeria. https://www.cgap.org/sites/default/files/publications/slidedeck/Insights_from_Smallholder_Household_Survey_Nigeria_1.pdf, archived at https://perma.cc/96M7-BNKD
de Andrade, F. M., Young, M. P., MacLeod, D., Hirons, L. C., Woolnough, S. J., & Black, E. (2021a). Subseasonal precipitation prediction for Africa: Forecast evaluation and sources of predictability. Weather and Forecasting, 36(1), 265–284. https://doi.org/10.1175/WAF-D-20-0054.1
de Andrade, F. M., Young, M. P., MacLeod, D., Hirons, L. C., Woolnough, S. J., & Black, E. (2021b). Subseasonal precipitation prediction for Africa: Forecast evaluation and sources of predictability. Weather and Forecasting, 36(1), 265–284. https://doi.org/10.1175/WAF-D-20-0054.1
Endris, H. S., Hirons, L., Segele, Z. T., Gudoshava, M., Woolnough, S., & Artan, G. A. (2021). Evaluation of the skill of monthly precipitation forecasts from global prediction systems over the greater Horn of Africa. Weather and Forecasting. https://doi.org/10.1175/WAF-D-20-0177.1
European Centre for Medium-Range Weather Forecasts. (n.d.-a). Atmospheric physics [Text]. Retrieved November 23, 2022, from https://www.ecmwf.int/en/research/modelling-and-prediction/atmospheric-physics, archived at https://perma.cc/NP6R-XK3G
European Centre for Medium-Range Weather Forecasts. (n.d.-b). Lead time of anomaly correlation coefficient (ACC) scores reaching multiple thresholds. Retrieved June 24, 2022, from https://www.ecmwf.int/en/forecasts/charts/catalogue/plwww_m_hr_ccafreachmulti_ts?facets=undefined&time=2022111100¶meter=Temperature%20850hPa, archived at https://perma.cc/D4T2-KUF5 and https://perma.cc/MRK3-WM3N
European Centre for Medium-Range Weather Forecasts. (n.d.-c). Observations. Retrieved November 23, 2022, from https://www.ecmwf.int/en/research/data-assimilation/observations, archived at https://perma.cc/SB7P-WBSL
European Centre for Medium-Range Weather Forecasts. (n.d.-d). S2S [Text]. Retrieved June 21 2022, from https://www.ecmwf.int/en/research/projects/s2s, archived at https://perma.cc/HLM7-XG3A
European Centre for Medium-Range Weather Forecasts. (n.d.-e). Scalability [Text]. Retrieved November 23, 2022, from https://www.ecmwf.int/en/about/what-we-do/scalability, archived at https://perma.cc/VF23-TWHF
Express News Service. (2022, February 3). Big financial push for Deep Ocean Mission in Union Budget. The Indian Express. https://indianexpress.com/article/india/big-financial-push-for-deep-ocean-mission-in-budget-7754071/, archived at https://perma.cc/R4TR-J5K2
Fatima, Z., Ahmed, M., Hussain, M., Abbas, G., Ul-Allah, S., Ahmad, S., Ahmed, N., Ali, M. A., Sarwar, G., Haque, E. ul, Iqbal, P., & Hussain, S. (2020). The fingerprints of climate warming on cereal crops phenology and adaptation options. Scientific Reports, 10(1), Article 1. https://doi.org/10.1038/s41598-020-74740-3
Fearn, N. (2015, February 1). Where does radio stand in a connected world? TNW. https://thenextweb.com/news/radio-stand-connected-world, archived at https://perma.cc/A2TV-RFQK
Feed the Future. (n.d.). Impact of agro-weather and market information on productivity and resilience in farming communities in Kenya. Retrieved November 25, 2022, from https://basis.ucdavis.edu/sites/g/files/dgvnsk466/files/2021-01/MRR%20project%20in-brief%20-%20Kamau%20Kenya%20ALL%20IN%20UPDATED.pdf, archived at https://perma.cc/7V9A-4EVA
Fink, A. H., Agustí-Panareda, A., Parker, D. J., Lafore, J.-P., Ngamini, J.-B., Afiesimama, E., Beljaars, A., Bock, O., Christoph, M., Didé, F., Faccani, C., Fourrié, N., Karbou, F., Polcher, J., Mumba, Z., Nuret, M., Pohle, S., Rabier, F., Tompkins, A. M., & Wilson, G. (2011). Operational meteorology in West Africa: Observational networks, weather analysis and forecasting. Atmospheric Science Letters, 12(1), 135–141. https://doi.org/10.1002/asl.324
Food and Agriculture Organization. (n.d.). Nigeria at a glance. United Nations. Retrieved November 28, 2022, from https://www.fao.org/nigeria/fao-in-nigeria/nigeria-at-a-glance/en/, archived at https://perma.cc/95UT-UP8N
Food and Agriculture Organization. (2019). Handbook on climate information for farming communities: What farmers need and what is available. United Nations. https://www.fao.org/3/ca4059en/ca4059en.pdf, archived at https://perma.cc/3CB8-CUZS
Gebrechorkos, S. H., Pan, M., Beck, H. E., & Sheffield, J. (2022). Performance of state-of-the-art C3S European seasonal climate forecast models for mean and extreme precipitation over Africa. Water Resources Research, 58(3), e2021WR031480. https://doi.org/10.1029/2021WR031480
Georgeson, L., Maslin, M., & Poessinouw, M. (2017). Global disparity in the supply of commercial weather and climate information services. Science Advances, 3(5), e1602632. https://doi.org/10.1126/sciadv.1602632
GiveWell. (2020, November). Precision Development (mobile-based agricultural advice). https://www.givewell.org/international/technical/programs/precision-agriculture-for-development, archived at https://perma.cc/2X9X-FXED
GiveWell. (2022, May). Precision Development (PxD) — scoping grant. https://www.givewell.org/research/incubation-grants/PxD-scoping-march-2022, archived at https://perma.cc/K3W6-XX9V
Global Challenges Research Fund African Science for Weather Information and Forecasting Techniques. (2021, April 26). Weather forecasts advance Nigeria’s fight for food security – GCRF African SWIFT. https://africanswift.org/2021/04/26/weather-forecasts-advance-nigerias-fight-for-food-security/, archived at https://perma.cc/GUV9-U4HS
Global Commission on Adaptation. (2019). Adapt now: A global call for leadership on climate resilience. World Resources Institute. https://doi.org/10.1596/32362
Hallegatte, S. (2012). A cost effective solution to reduce disaster losses in developing countries: Hydro-meteorological services, early warning, and evacuation. The World Bank. https://doi.org/10.1596/1813-9450-6058
Hallegatte, S., Vogt-Schilb, A., Bangalore, M., & Rozenberg, J. (2017). Unbreakable: Building the resilience of the poor in the face of natural disasters. Washington, DC: World Bank. https://doi.org/10.1596/978-1-4648-1003-9
Hansen, J. W., Mason, S. J., Sun, L., & Tall, A. (2011). Review of seasonal climate forecasting for agriculture in sub-Saharan Africa. Experimental Agriculture, 47(2), 205–240. https://doi.org/10.1017/S0014479710000876
IGAD Climate Prediction and Applications Centre. (2022). Seasonal forecast. https://www.icpac.net/seasonal-forecast/june-to-september-2022/?region=1&resource_type=27, archived at https://perma.cc/8WYP-F4V4
Ignitia. (n.d.-a). Our impact. Retrieved November 30, 2022, from https://www.ignitia.se/our-impact, archived at https://perma.cc/GW8Y-7E3C
Ignitia. (n.d.-b). What we do. Retrieved June 21, 2022, from https://www.ignitia.se/iska, archived at https://perma.cc/EGM2-97PF
Iizumi, T., & Ramankutty, N. (2015). How do weather and climate influence cropping area and intensity? Global Food Security, 4, 46–50. https://doi.org/10.1016/j.gfs.2014.11.003
India Meteorological Department. (n.d.). Monsoon. Ministry of Earth Sciences, Government of India. Retrieved June 21, 2022, from https://mausam.imd.gov.in/imd_latest/contents/monsoon.php, archived at https://perma.cc/Q8LT-NYNC
International Data Rescue Portal. (n.d.). Projects overview. Commission for Climate, World Meteorological Organization. Retrieved November 28, 2022, from https://www.idare-portal.org/projects-overview?field_wmo_region_tid=1, archived at https://perma.cc/E2EF-JXX7
International Fund for Agricultural Development. (2011, February). Smallholders can feed the world. https://www.ifad.org/documents/38714170/40706188/Smallholders+can+feed+the+world_e.pdf/460ca6c2-7621-40d8-9f79-a56f6f8fa75e?t=1531732928000, archived at https://perma.cc/M7J6-9TB2
International Research Institute for Climate and Society. (2017). Report to Securing Water for Food (SWFF) and USAID on evaluation of Ignitia daily rainfall forecasts for subscribers in West Africa. The Earth Institute, Columbia University. https://securingwaterforfood.org/wp-content/uploads/2018/06/IRI-validation-study-of-Ignita.pdf, archived at https://perma.cc/YF2N-DAEC
Ismail, S. (2015, February 13). World Radio Day: 9 radio stations we’re tuning into. ONE. https://www.one.org/us/blog/world-radio-day-9-radio-stations-were-tuning-into/, archived at https://perma.cc/E6NL-EPLK
Kalu, I. (2021a, July 22). Press release: Ignitia closes USD 4.2m financing round to fuel expansion. Ignitia. https://www.ignitia.se/post/press-release-ignitia-closes-usd-4-2m-financing-round-to-fuel-expansion, archived at https://perma.cc/R7QB-HXNK
Kalu, I. (2021b, August 3). A key resource for farmers. Ignitia. https://www.ignitia.se/post/a-key-resource-for-farmers, archived at https://perma.cc/6KXG-7FMT
Kamer, L. (2022, November 17). Agriculture in Nigeria - statistics and facts. Statista. https://www.statista.com/topics/6729/agriculture-in-nigeria/, archived at https://perma.cc/WY3M-9N4C
Kull, D., Riishojgaard, L. P., Eyre, J., & Varley, R. A. (2021). The value of surface-based meteorological observation data. International Bank for Reconstruction and Development/The World Bank, WMO and British Crown, Met Office. https://openknowledge.worldbank.org/bitstream/handle/10986/35178/The-Value-of-Surface-based-Meteorological-Observation-Data.pdf?sequence=1&isAllowed=y, archived at https://perma.cc/AT7U-SXRK
Laux, P. (2017). Special project final report. https://www.ecmwf.int/sites/default/files/special_projects/2014/spdelaux-2014-finalreport.pdf, archived at https://perma.cc/3WSA-ZPL6
Lowder, S. K., Bertini, R., Karfakis, P., Croppenstedt, A., Lowder, S. K., Bertini, R., Karfakis, P., & Croppenstedt, A. (2016). Transformation in the size and distribution of farmland operated by household and other farms in select countries of sub-Saharan Africa. https://doi.org/10.22004/AG.ECON.246969
Lowder, S. K., Skoet, J., & Raney, T. (2016). The number, size, and distribution of farms, smallholder farms, and family farms worldwide. World Development, 87, 16–29. https://doi.org/10.1016/j.worlddev.2015.10.041
Met Office. (n.d.-a). Introduction to seasonal forecasting. Retrieved November 23, 2022, from https://www.metoffice.gov.uk/research/climate/seasonal-to-decadal/gpc-outlooks/user-guide/background, archived at https://perma.cc/M84Y-95J6
Met Office. (n.d.-b). Using a computer model to make a forecast. Retrieved June 20, 2022, from https://www.metoffice.gov.uk/weather/learn-about/how-forecasts-are-made/computer-models/index, archived at https://perma.cc/3RZB-XDQG
Met Office. (2022, March 25). Victorian rainfall data rescued. https://www.metoffice.gov.uk/about-us/press-office/news/weather-and-climate/2022/rescued-victorian-rainfall-data-released, archived at https://perma.cc/KE9G-J5DC
Meza, F. J., Hansen, J. W., & Osgood, D. (2008). Economic value of seasonal climate forecasts for agriculture: Review of ex-ante assessments and recommendations for future research. Journal of Applied Meteorology and Climatology, 47(5), 1269–1286. https://doi.org/10.1175/2007JAMC1540.1
Nathan Associates. (2018). CGAP smallholder household data: Analysis and insights from the national surveys and financial diaries. https://www.findevgateway.org/sites/default/files/publications/submissions/78901/Nathan%20Associates%20Smallholder%20Data%20Paper_compressed.pdf, archived at https://perma.cc/NM8W-JG6A
National Oceanic and Atmospheric Administration. (2020). NOAA Budget Summary 2021. United States Department of Commerce. https://www.noaa.gov/sites/default/files/legacy/document/2020/Mar/508%20Compliant_NOAA%20FY21%20Budget%20Blue%20Book%20Summary.pdf
Noy, I. (2016). A global comprehensive measure of the impact of natural hazards and disasters. Global Policy, 7(1), 56–65. https://doi.org/10.1111/1758-5899.12272
Nyadzi, E., Werners, E. S., Biesbroek, R., Long, P. H., Franssen, W., & Ludwig, F. (2019). Verification of seasonal climate forecast toward hydroclimatic information needs of rice farmers in northern Ghana. Weather, Climate, and Society, 11(1), 127–142. https://doi.org/10.1175/WCAS-D-17-0137.1
Olaniyan, E., Adefisan, E. A., Balogun, A. A., & Lawal, K. A. (2019). The influence of global climate drivers on monsoon onset variability in Nigeria using S2S models. Modeling Earth Systems and Environment, 5(4), 1405–1428. https://doi.org/10.1007/s40808-019-00606-x
Olaniyan, E., Adefisan, E. A., Oni, F., Afiesimama, E., Balogun, A. A., & Lawal, K. A. (2018). Evaluation of the ECMWF Sub-seasonal to Seasonal precipitation forecasts during the peak of West Africa Monsoon in Nigeria. Frontiers in Environmental Science, 6, 4. https://doi.org/10.3389/fenvs.2018.00004
Ouédraogo, M., Zougmoré, R., Barry, S., Somé, L., & Grégoire, B. (2015). The value and benefits of using seasonal climate forecasts in agriculture: Evidence from cowpea and sesame sectors in climate-smart villages of Burkina Faso [Info note]. CGIAR Research Program on Climate Climate Change, Agriculture and Food Security. https://cgspace.cgiar.org/handle/10568/68537, archived at https://perma.cc/YFR3-YEST
Owens, R. G., & Hewson, T. D. (2018). Anomaly correlation coefficient. In ECMWF Forecast User Guide (p. Section 6.4). European Centre for Medium-Range Weather Forecasts. https://doi.org/10.21957/m1cs7h
Oyaniran, T. (2020, September). Current state of Nigeria agriculture and agribusiness sector. PricewaterhouseCoopers. https://www.pwc.com/ng/en/assets/pdf/afcfta-agribusiness-current-state-nigeria-agriculture-sector.pdf, archived at https://perma.cc/HE9N-UTWJ
Pirret, J. S. R., Daron, J. D., Bett, P. E., Fournier, N., & Foamouhoue, A. K. (2020). Assessing the skill and reliability of seasonal climate forecasts in Sahelian West Africa. Weather and Forecasting, 35(3), 1035–1050. https://doi.org/10.1175/WAF-D-19-0168.1
Rathore, L. S., & Chattopadhyay, N. (2016). Weather and climate services for farmers in India. Bulletin of the World Meteorological Organization, 65(2), 40–43. https://public.wmo.int/en/resources/bulletin/weather-and-climate-services-farmers-india, archived at https://perma.cc/5UAD-L4CM
Ricciardi, V., Ramankutty, N., Mehrabi, Z., Jarvis, L., & Chookolingo, B. (2018). How much of the world’s food do smallholders produce? Global Food Security, 17, 64–72. https://doi.org/10.1016/j.gfs.2018.05.002
Ritchie, H. (2021). Smallholders produce one-third of the world’s food, less than half of what many headlines claim. Our World in Data. https://ourworldindata.org/smallholder-food-production, archived at https://perma.cc/BVH3-QG8C
Ritchie, H., & Roser, M. (2021). Farm size. Our World in Data. https://ourworldindata.org/farm-size, archived at https://perma.cc/LZK8-REGH
Rogers, D. P., & Tsirkunov, V. V. (2013). Weather and climate resilience: Effective preparedness through national meteorological and hydrological services. The World Bank. https://doi.org/10.1596/978-1-4648-0026-9
Roncoli, C. (2006). Ethnographic and participatory approaches to research on farmers’ responses to climate predictions. Climate Research, 33(1), 81–99. https://www.int-res.com/articles/cr_oa/c033p081.pdf, archived at https://perma.cc/TXM7-E78D
Rosenzweig, M. R., & Udry, C. (2019a). Assessing the benefits of long‐run weather forecasting for the rural poor: Farmer investments and worker migration in a dynamic equilibrium model (Yale University Economic Growth Center Discussion Paper No. 1065). https://doi.org/10.2139/ssrn.3438331
Rosenzweig, M. R., & Udry, C. R. (2019b). Assessing the benefits of long-run weather forecasting for the rural poor: Farmer investments and worker migration in a dynamic equilibrium model (NBER Working Paper No. 25894). National Bureau of Economic Research. https://doi.org/10.3386/w25894
Sasu, D. D. (n.d.). Nigeria: agricultural areas, by type. Statista. Retrieved November 28, 2022, from https://www.statista.com/statistics/1135880/agricultural-areas-in-nigeria/, archived at https://perma.cc/6QG7-GXTH
Securing Water for Food. (2018). Ignitia impact evaluation: Impact assessment of Ignitia’s Iska SMS weather prediction on farming in Ghana. https://securingwaterforfood.org/wp-content/uploads/2018/09/Ignitia-Impact-Evaluation_Sept-2018.pdf, archived at https://perma.cc/7SHJ-KW5E
South African Weather Service. (2022). Seasonal climate watch: May to September 2022. https://www.weathersa.co.za/Documents/SeasonalForecast/SCOLF202204_06052022092942.pdf, archived at https://perma.cc/5N5H-2DS9
Stacey, J., Richardson, K., Krijnen, J., & Janes, T. (2019). Seasonal forecasting in South Asia: A review of the current status. Asia Regional Resilience to a Changing Climate, Met Office, Government of the United Kingdom. https://www.metoffice.gov.uk/binaries/content/assets/metofficegovuk/pdf/business/international/scipsa_review_seasonal_forecasting_south_asia_final.pdf, archived at https://perma.cc/BJ38-RCVS
Statista Research Department. (2022, September 20). Number of internet and social media users worldwide as of July 2022. Statista. https://www.statista.com/statistics/617136/digital-population-worldwide/, archived at https://perma.cc/MA54-QEYC
Statistics Times. (2018, November 20). List of countries by GDP sector composition. https://statisticstimes.com/economy/countries-by-gdp-sector-composition.php, archived at https://perma.cc/RVT3-3EKY
Stewart, D. (2018, December 11). Radio: Revenue, reach, and resilience. Deloitte Insights. https://www2.deloitte.com/content/www/us/en/insights/industry/technology/technology-media-and-telecom-predictions/radio-revenue.html, archived at https://perma.cc/FP2R-TLAK
Stone, R. C., & Meinke, H. (2006). Weather, climate, and farmers: an overview. Meteorological Applications, 13(S1), 7–20. https://doi.org/10.1017/S1350482706002519
Systematic Observations Financing Facility. (2021). Terms of reference. https://alliancehydromet.org/wp-content/uploads/2021/10/SOFF-Terms-of-Reference.pdf, archived at https://perma.cc/97HL-5H4Y
Tall, A. (Ed.). (2012). Identifying good practice in the provision of climate services for farmers in Africa and South Asia [Background paper]. http://www.hubrural.org/IMG/pdf/ccafs_2012_white_paper_-_good_practices_in_scaling_up_climate_services_for_farmers.pdf, archived at https://perma.cc/PZ5Y-CM28
Tall, A., Jay, A., & Hansen, J. (2012). Scaling up climate services for farmers in Africa and South Asia (Workshop Report No. 40). CGIAR Research Program on Climate Climate Change, Agriculture and Food Security. https://cgspace.cgiar.org/bitstream/handle/10568/27833/wp40.pdf?sequence=1, archived at https://perma.cc/Y6K9-WMCA
Tamming, M., & Sadiq, S. (2022, February 18). Cottoning on: A free weather product for Punjab’s cotton belt. Precision Development. https://precisiondev.org/weather-forecasting-product-for-punjab-pakistan/, archived at https://perma.cc/2S87-KKWN
Tata-Cornell Institute. (2021, September 1). TCI launches hub for FPOs to empower smallholder farmers in India. https://tci.cornell.edu/?news=tci-launches-hub-for-fpos-to-empower-smallholder-farmers-in-india, archived at https://perma.cc/M7VH-VTVJ
US Agency for International Development. (n.d.). Grant: Weathering the storm: Improving food security through accurate weather forecasts. Retrieved November 30, 2022, from https://divportal.usaid.gov/s/project/a0gt0000001CKv4AAG/weathering-the-storm-improving-food-security-through-accurate-weather-forecasts, archived at https://perma.cc/J49H-BYQ9
Van der Burgt, F., Van Pelt, S., & Lobbrecht, A. (2018). Mobile weather services for small-scale farmers: Success factors from African case studies. Weather Impact. https://www.weatherimpact.com/wp-content/uploads/2019/10/MobileWeatherServicesforSmallScaleFarmers_WeatherImpact.pdf, archived at https://perma.cc/T9L5-V24A
Van Pelt, S. (2017, November 27). Weather forecasts for sesame farmers in Ethiopia. Weather Impact. https://www.weatherimpact.com/weather-forecasts-for-sesame-farmers-in-ethiopia/, archived at https://perma.cc/63KR-HQS9
Vaughan, C., Hansen, J., Roudier, P., Watkiss, P., & Carr, E. (2019). Evaluating agricultural weather and climate services in Africa: Evidence, methods, and a learning agenda. WIREs Climate Change, 10(4), e586. https://doi.org/10.1002/wcc.586
Wageningen University & Research. (2021, November 17). Living income in cocoa. https://www.wur.nl/en/newsarticle/living-income-in-cocoa.htm, archived at https://perma.cc/X6YH-2YQ7
Walker, D. P., Birch, C. E., Marsham, J. H., Scaife, A. A., Graham, R. J., & Segele, Z. T. (2019). Skill of dynamical and GHACOF consensus seasonal forecasts of East African rainfall. Climate Dynamics, 53(7), 4911–4935. https://doi.org/10.1007/s00382-019-04835-9
Walker, S. (2021). Value-added weather advisories for small-scale farmers in South Africa delivered via mobile apps*. Irrigation and Drainage, 70(3), 505–511. https://doi.org/10.1002/ird.2506
Wang, Y., Gueye, M., Greybush, S. J., Greatrex, H., Whalen, A. J., Ssentongo, P., Zhang, F., Jenkins, G. S., & Schiff, S. J. (2022). Verification of operational numerical weather prediction model forecasts of precipitation using satellite rainfall estimates over Africa (arXiv:2201.02296). arXiv. http://arxiv.org/abs/2201.02296, archived at https://perma.cc/UDC3-DU7K
Weisheimer, A., & Palmer, T. N. (2014). On the reliability of seasonal climate forecasts. Journal of The Royal Society Interface, 11(96), 20131162. https://doi.org/10.1098/rsif.2013.1162
World Bank. (n.d.-a). Individuals using the Internet (% of population). Retrieved November 28, 2022, from https://data.worldbank.org/indicator/IT.NET.USER.ZS, archived at https://perma.cc/UZ34-GZVH
World Bank. (n.d.-b). Population, total - Nigeria. Retrieved November 28, 2022, from https://data.worldbank.org/indicator/SP.POP.TOTL?locations=NG, archived at https://perma.cc/E6ZR-ZNLA
World Bank. (2016, February 25). A year in the lives of smallholder farmers [Text/HTML]. World Bank. https://www.worldbank.org/en/news/feature/2016/02/25/a-year-in-the-lives-of-smallholder-farming-families, archived at https://perma.cc/77N9-TPBQ
World Meteorological Organization. (n.d.-a). Regional climate outlook forums. Retrieved July 16, 2022, from https://public.wmo.int/en/our-mandate/climate/regional-climate-outlook-products, archived at https://perma.cc/4SDY-R335
World Meteorological Organization. (n.d.-b). The Subseasonal-to-Seasonal prediction project. Retrieved July 5, 2022, from https://public.wmo.int/en/projects/subseasonal-seasonal-prediction-project, archived at https://perma.cc/5J27-6Z77
World Meteorological Organization. (2015). Valuing weather and climate: Economic assessment of meteorological and hydrological services (No. 1153). https://library.wmo.int/doc_num.php?explnum_id=3314, archived at https://perma.cc/C37R-SCGV.
World Meteorological Organization. (2018). Multi-hazard early warning systems: A checklist. https://library.wmo.int/doc_num.php?explnum_id=4463, archived at https://perma.cc/EM4Q-B9SH
World Meteorological Organization. (2020a). The gaps in the Global Basic Observing Network (GBON) [Information brief]. Systematic Observations Financing Facility. https://library.wmo.int/doc_num.php?explnum_id=10377, archived at https://perma.cc/7KUU-MCBL
World Meteorological Organization. (2020b). The value of surface-based meteorological observation data: Costs and benefits of the Global Basic Observing Network [Information brief]. Systematic Observations Financing Facility. https://library.wmo.int/doc_num.php?explnum_id=10376, archived at https://perma.cc/D9DX-G82P
World Meteorological Organization. (2022a, March). Targeting early warning systems for 100% of Earth’s population in five years. MeteoWorld, 1(1). https://public.wmo.int/en/resources/meteoworld/targeting-early-warning-systems-100-of-earth%E2%80%99s-population-five-years, archived at https://perma.cc/C2F7-NFEQ
World Meteorological Organization. (2022b, March 23). Early warning systems must protect everyone within five years. https://public.wmo.int/en/media/press-release/%E2%80%8Bearly-warning-systems-must-protect-everyone-within-five-years, archived at https://perma.cc/L654-38GQ
World Meteorological Organization. (2022c). WMO Unified Data Policy. https://library.wmo.int/doc_num.php?explnum_id=11256, archived at https://perma.cc/BG9H-K5VA
Youds, L. H., Parker, D. J., Adefisan, E. A., Antwi-Agyei, P., Bain, C. L., Black, E. C. L., Blyth, A. M., Dougill, A. J., Hirons, L. C., Indasi, V. S., Lamptey, B. L., Marshall, F., Marsham, J. H., Stein, T. H. M., Taylor, C. M., Todd, M. C., Visman, E. L., & Woolnough, S. J. (2021). GCRF African SWIFT and ForPAc SHEAR white paper on the potential of operational weather prediction to save lives and improve livelihoods and economies in sub-Saharan Africa [Monograph]. University of Leeds. https://doi.org/10.5518/100/79
Appendices
Appendix A: Tables

| Timescale | Evidence | Confidence level |
| Short-range (up to 5 days) |
|
High for Africa
Moderately high for poorer LMICs Medium for India |
| Subseasonal (2-4 weeks) |
|
Moderately high for Africa
Medium for other LMICs |
| Seasonal |
|
Moderately high for all regions |
Table A3: Brief, non-exhaustive review of literature that evaluates outputs of global NWPs for LMICs of interest.
| Citation | Region/ Country | Weather phenomena | Conclusions |
| Endris et al. (2021) | Horn of Africa | Monthly precipitation |
|
| Wang et al. (2022) | Africa | Precipitation (daily and weekly aggregate) |
|
| Chevuturi et al. (2021) | India | Monsoon onset |
|
| Nyadzi et al. (2019) | Ghana | Precipitation and temperature |
|
| Gebrechorkos et al. (2022) | Africa | Precipitation (seasonal, monthly and weekly) and drought |
|
| Olaniyan et al. (2018) | Nigeria | Precipitation |
|
| Olaniyan et al. (2021) | Nigeria | Rainfall onset |
|
| Andrade et al. (2021) | Africa | Precipitation |
|
| Pirret et al. (2020) | West Africa | Precipitation |
|
Appendix B: Caveats on the Ignitia study
Some caveats to the $480 figure cited by an independent evaluation of Ignitia in 2018 (Securing Water for Food, 2018):
- There is likely to be significant selection bias in people interviewed. This is relevant for the figures around weather prediction source, willingness to pay, and perceived and reported benefits. The availability to make a phone interview or have a meeting scheduled will likely select for those who have more spare time, use their phones more, or have found more success with the program. Of 1,934 participants, 59 made either the phone interview or a scheduled meeting.
- Around 33% of people will already be receiving some forecast info from the internet, TV, and/or radio. ISKA likely provides the most value for the 67% of those who were depending on cloud, sky, and/or heat for their forecasts.
- The initial selection criteria for interviewees was to have received weather messages for “at least one season, not more than two seasons.” However, due to “data errors,” the inclusion criteria were broadened and included farmers who had received the services for less than three months, as well as 63% of farmers who had received messages for at least two years. (“Thirty-one percent of the farmers had received the messages since 2015. Twenty-two percent of the farmers had received the messages for three years, and 10 percent of the respondents had received the messages for four years or more.”)
- This independent study had a different study population, from farm size (average of 1.5 hectares, compared to 0.91 hectares reported by Ignitia), to amount of produce (average of 11.02 tonnes compared to 2.40 tonnes reported by Ignitia).
We could not find a clear breakdown of where the $480 comes from (e.g., cost savings from farmers, wasted fertilizer, increased yield, etc.).
Appendix C: Estimates for number of smallholder farms
Our estimate of the number of smallholder farms can be found in this spreadsheet: Estimates for number of farms.
Our starting point is a list of all low- and lower-middle income countries, as defined by the World Bank. We remove Ukraine and North Korea, as these are out of scope.
To calculate the number of smallholder farms per country, we primarily rely on the estimates provided by Our World in Data (OWID; Ritchie & Roser, 2021). This information is not available for all countries, and so we identified major missing countries based on agricultural GDP, by referring to a compilation sourced from the CIA World Factbook (Statistics Times, 2018). Seven LMICs with total agricultural GDP >$10 billion were identified as needing separate estimates.
For each missing country, we selected a comparison country that has data in the OWID source. Comparison country selection was not done in a systematic way, but was broadly based on similarity in terms of the relative importance of agriculture (as measured by agricultural GDP as percent of total GDP) as well as country size. Our estimates assume that the number of smallholder farms and agricultural GDP are directly correlated, such that 1.5x agricultural GDP meant 1.5x smallholder farm numbers, across all GDP levels. The choice of comparison country does affect our total significantly, and as such we calculate twice to give an upper and lower bound.
To account for the age of the OWID estimates, which are primarily from the 1990s and early 2000s, we crudely adjust using the rate of growth in India over the last two decades.
Including only those countries included in OWID and crudely adjusting to the 2020s gives a total of 216 million farms under 2 ha. The additional seven countries add 43 million-90 million farms to the total, depending on the method used.
This is a rough estimate with a number of strong assumptions, including a single growth applied to all countries on the basis of one comparison for India.
As a test, we sense-checked the numbers for Nigeria, a major country that was not included in the OWID source. Our estimate using the method described above ranges from 6 million to 32 million, depending on the comparison country. Sense-checks described below suggest that 32 million is slightly high for an upper bound, but overall, the estimates are within the range we have used above.
Sense-check 1: Nigeria has a population of 211 million (World Bank, n.d.-b). Multiple sources report that ~70% of the Nigerian population engages in agriculture (FAO, n.d.; Kamer, 2022). Another source suggests that 80% of Nigeria’s farmers are smallholder farmers, though the size of a smallholder farm is not defined (Oyaniran, 2020). If we take these together, then we would expect there to be 211 million × 0.7 × 0.8 = 118.2 million smallholder farmers in Nigeria. Assuming five household members per farm, this suggests 23.6 million farms.
Sense-check 2: Nigeria has 69 million hectares of agricultural land (Sasu, 2022). Lowder et al. (2016) suggest that smallholder farms (<2 ha) operate on only 5% of the land, which would equate to a total of 3.45 million hectares. This would seem to suggest fewer than 10 million smallholder farms in Nigeria; for example, if we made the strong assumption of an average size of 0.5 ha, the total number of farms would be 6.9 million.
To calculate estimates assuming that a smallholder farm is defined as “up to 5 ha,” or “up to 10 ha,” we relied on the unadjusted OWID data. In each case, we crudely constructed a ratio versus <2 ha farms. Our confidence in the point estimate is low because we are aware of issues in the underlying data: it is incomplete (e.g., Nigeria is missing) and some of the countries included do not seem to capture any farms smaller than 5 ha (e.g., Zambia).Notes
-
These are collectively referred to as LMICs throughout the report, for simplicity. ↩
-
A more comprehensive list of decisions and the respective timescales on which weather information is needed can be found in Stone and Mienke (2006). The Appendix also includes a table showing examples of climate adaptation strategies by crop type and region. ↩
-
We have some uncertainty about these figures, as detailed further in Appendix B. ↩
-
The studies underlying this range were published between 2000 and 2018. ↩
-
Including all farms up to 10 ha, this would cover a total of 40% of agricultural land for 55% of global food supply. ↩
-
Five people per farm is a rough estimate based on results from large-scale representative surveys of smallholder farms conducted by the Consultative Group to Assist the Poor (CGAP) in Nigeria, Tanzania, Mozambique, and Pakistan (CGAP, 2017, Slide 22; Nathan Associates, 2018, p. 10). ↩
-
As a sense-check, there are multiple sources that suggest 500 million smallholder farming households globally (International Fund for Agricultural Development, 2011; World Bank, 2016), though we have not found a documented methodology for these estimates. Assuming these include all farms under 10 ha, and all countries, our estimate of 372 million farms is lower, but some of the difference may be explained by the fact that we exclude upper-middle- and high-income countries, including China. ↩
-
The exact needs differ somewhat across crops. For example, bananas and sesame are sensitive to wind, coffee is sensitive to heat waves (Van der Burgt et al., 2018, p. 14; Nabansu Chattopadhyay, personal communication, June 14, 2022) and geographical regions, e.g., monsoon vs. (semi-)arid regions. ↩
-
In our understanding, seasonal forecasting can refer to any time scale between one month and one year (see WMO, 2015, p. 17), though in most cases we have seen it refers to three to six months (e.g., Met Office, n.d.-a; Deutscher Wetterdienst, n.d.). ↩
-
All information provided throughout the season. ↩
-
Note that this paper evaluates the previous iteration of ECMWF modeling. ↩
-
The live link to the ECMWF evaluation charts for seasonal forecasts of temperature and precipitation is here. ↩
-
We assessed the heat maps by visually comparing the colors for Africa and South/Southeast Asia to the key, to assess whether the ACC was generally above or below 0.6. We also visually compared the temperature and precipitation charts side-by-side. In both cases, we did this for four time points: December, March, June and September. Archived versions of the charts for December are available for temperature (here) and precipitation (here). ↩
-
Note that we do not have the technical expertise to discriminate between the charts available from the ECMWF to identify the ‘best’ evidence of poorer performance for the tropics. This is an example; it may be that another chart, or level of accuracy, is more informative. ↩
-
Further examples include this May 2022 “Seasonal Climate Watch” document for Southern Africa (South African Weather Service, 2022), and this May 2022 seasonal temperature forecast for all of Africa (African Centre of Meteorological Applications for Development & Intra-ACP Climate Services and related Applications Programme, 2022). ↩
-
We have not found any evaluation of the impact of this project. ↩
-
Below (here) we estimate that these costs might be $30,000 - $60,000 per year. ↩
-
The evaluation finds that Ignitia’s figure of 84% is based on only ~5% of all forecasts that the organization issues, as the claim is based only on forecasts of “high probability of rain (>80%).” ↩
-
We excluded NMHSes and government initiatives from this list. ↩
-
This impression was shared by Chris Udry. ↩
-
The $48 billion benefit was calculated as an update to the calculations in Hallegatte (2013), assuming that the economic benefit of weather information is 1% loss avoidance for 25% of global GDP (the assumed value of all weather-sensitive sectors). Our main issue with this approach is that it relies on a “from first principles” simplifying assumption. While this method is also used for other, smaller categories that make up the authors’ estimate, we felt that it was not robust enough to substantiate the single largest contributor to the authors’ estimate (~30% of the total). Instead we relied on direct estimates as in Hallegatte et al. (2017, p. 126, Figure 5.4). ↩
-
Out of interest, the ratio in upper-middle and high-income countries is estimated as 3.5x, and the largest benefit is attributed to energy, not agriculture. ↩
-
EM-DAT figures are based on averages for data from 2020 - 2022, excluding events that we think are less related to weather forecasting (i.e., diseases, earthquakes, and volcanoes). ↩
-
At the time of writing, the OP bar was 1,000x. This may change over time. Our estimate focuses on the benefits to populations in LMICs and LICs, but note that it remains below the OP bar even if we consider global benefits (47 - 143x). It also remains below the bar if we reduce the costs of SOFF to only installation and maintenance (upper bound of 250x). ↩
-
If we have correctly understood the importance of large-scale atmospheric patterns to weather forecasting, this could help to narrow the scope of evaluations, e.g., if a global NWP models the Madden-Julian Oscillation well, then an evaluation could focus on a place and time of year where this driver is particularly deterministic. ↩
-
For example, S2S data was used to produce maps showing forecasts for the continent (see ACMAD, 2022a, for an example of the precipitation projection 10 days in advance), as well as charts showing daily forecasts of precipitation, temperature, wind speed and other conditions at the sub-national level (see ACMAD, 2022b, and ACMAD, 2022c, for examples for Bauchi state in Nigeria). ↩
-
Based on the WMO page for the project, the total budget was $300,000 (WMO, n.d.-b). The project was originally five years long, and then was extended for an additional five years. Depending on whether the costs cover the initial five-year period or the entire 10-year project, the cost is $60,000 or $30,000 per year. It seems likely that $60,000 per year is an upper bound, given the project budget likely contained costs for activities other than data provision. ↩
-
Douglas Parker shared that the costs for the basic data fields needed for a rainfall projection may be $3,000 per year. ↩