An overview of WHO Prequalification: Process, usage, and potential improvements
Editorial note
This report is a “shallow” investigation, as described here, and was commissioned by Open Philanthropy and produced by Rethink Priorities from July to August 2022. We updated and revised this report for publication. Open Philanthropy does not necessarily endorse our conclusions, nor do the organizations represented by those who were interviewed.
The primary focus of the report is to provide a review of WHO Prequalification (WHO-PQ). We focused mostly on how it works and how it’s funded, as well as how it came about and how it could be improved for a greater global health impact. We reviewed the scientific and gray literature and spoke to four experts.
We don’t intend this report to be Rethink Priorities’ final word on WHO-PQ, and we have tried to flag major sources of uncertainty in the report. We hope this report galvanizes a productive conversation within the effective altruism community about the role of WHO-PQ in improving global health. We are open to revising our views as more information is uncovered.
In October 2023, we corrected the price per product registration charged by the Kenyan NRA. We previously stated this was $5,000 per registration, based on our interview with a health consultant we interviewed, but later the individual informed us by email that this should be lower ($500 - $1,000).
Key takeaways
- WHO-PQ evaluates applications from manufacturers to determine whether their products meet its standards of quality, safety, and efficacy. If so, then the product is “listed,” i.e., added to the relevant prequalified list. These lists are publicly available, and are used by some countries to inform their own national authorization of products; the lists are also used as criteria for tendering and procurement. [more]
- There are four product streams within WHO-PQ: vaccines, medicines, diagnostics, and vector control. There is also a cross-cutting Inspection Services team. [more]
- WHO program areas define which specific products fall within WHO-PQ’s scope. Manufacturers can only submit applications for these products. WHO-PQ’s assessment consists of both a desk audit and site inspection. After prequalification, products can be delisted. [more]
- The program was originally created in 1987 to inform UNICEF’s procurement of vaccines for immunization programs. It then expanded to medicines in 2001, and diagnostics in 2010. Vector control was added in 2017. [more]
- WHO-PQ’s estimated total budget is $30 million-$40 million per year (75% confidence). An estimated breakdown of the major funding streams is ~50% from Unitaid (focused on medicines and diagnostics for TB, malaria, and HIV/AIDS), ~20% from the Bill and Melinda Gates Foundation (BMGF), and approximately 30% covered by fees paid by manufacturers. [more]
- It is unclear whether WHO-PQ’s fees negatively impact access, as they may deter manufacturers from pursuing prequalification, but we were unable to assess whether this is the case. [more]
- Prequalified products must also be authorized by the national regulatory authority (NRA) in each country where they will be used. Two years is a conservative estimate of how long this process takes. [more]
- Prequalification most directly influences country registration via the Collaborative Registration Procedure (CRP). This effort reduces the timeline for country registration to a median of 90 days, versus two years. However, its implementation is currently limited, primarily to medicines. [more]
- Products covered by WHO-PQ are a small subset (~10%) of the products on the Essential Medicines List (EML). Future expansions of WHO-PQ’s scope will be based on the EML or perceived priority needs (e.g., COVID products). [more]
- Most international procurement agencies use the prequalified lists as a key requirement of their tenders for product categories within PQ’s scope. [more]
- Our initial thinking explores four potential ways that better
resourcing could have impact [more]:
- by causing WHO-PQ to extend to more products or new product streams: we estimate that current scope only covers up to 48% of global DALYs, leaving room for expansion, but understand that a WHO headcount freeze may be blocking this action.
- by speeding up PQ and country registration processes: we outline efforts that could help, such as increased regionalization or use of abridged assessments.
- by increasing the number of applications to WHO-PQ: we briefly explore three ways that funding (rather than fees) could support more applications.
- by improving the quality of products that have been prequalified.
WHO-PQ is organized into four product streams, and products go through a six-stage process to be prequalified
According to the WHO-PQ’s “What We Do” page (WHO, n.d.-u), the program’s aim is to “ensure that key health products meet global standards of quality, safety and efficacy, in order to optimize use of health resources and improve health outcomes.”
Prequalification is a term from procurement, which “refers to limiting a global public tender to fewer than the total number of possible suppliers” (Dellepiane & Wood, 2015, p. 53). WHO-PQ evaluates applications from manufacturers to determine whether products meet its standards of quality, safety, and efficacy. If so, then the product is “listed,” i.e., added to the relevant prequalified list. These lists are publicly available, and are used by some countries to inform their own process of authorizing products (more). The lists are also used by countries and international donors as a key criterion for tendering and procurement (more).
The WHO-PQ program is split into four product streams and one Inspection Services team that works across all products. PQ sits within the WHO’s Access to Medicines and Health Products programmatic division (WHO, n.d.-u) — specifically within the Regulation and Prequalification (RPQ) department (WHO, n.d.-p).
An external assessment of WHO-PQ’s impact estimated that prequalification had enabled $3.5 billion of donor funds to be spent on safe and effective medicines, vaccines, and diagnostics, reaching 400 million additional patients annually (“Impact Assessment,” 2019, pp. 3-4). The estimated cost-benefit ratio — calculated by comparing the cost of WHO-PQ with the savings generated through increased market competition — was 30x-40x (“Impact Assessment,” 2019, p. 36). This may vary by product over time: the Clinton Health Access Initiative (CHAI) estimated that for first-line antiretroviral therapy, the ratio was 200x in 2004, and 170x in 2009 (’t Hoen et al., 2014, p. 155).1
There are four product streams
The four product streams within WHO-PQ are: vaccines, medicines, in vitro diagnostics (IVD), and vector control. More on the history and development of each product stream can be found here.
Figure 1 is a useful visualization of the scope of each product stream as of January 2019.2 Since this time, some of the product streams have also been extended, as shown in Figure 3. For example, IVD now also encompasses Ebola diagnostics, and insulin was added to the WHO-PQ medicines stream.
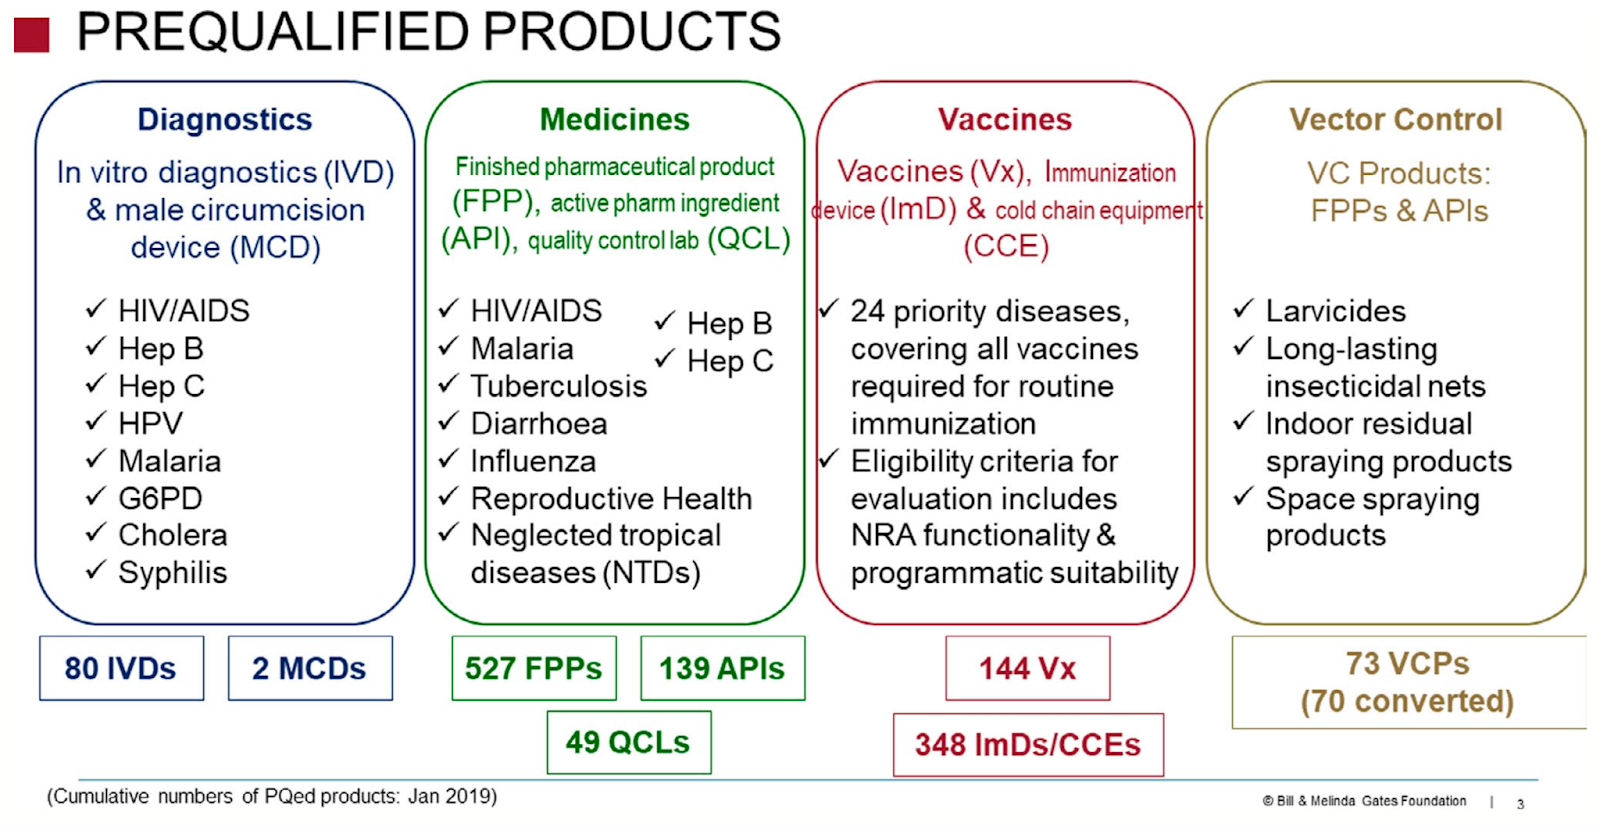
Figure 1 : Scope of product streams within WHO-PQ, as of January 2019. From “Twenty-five years of the WHO vaccines prequalification programme (1987–2012): Lessons learned and future perspectives,” by T. F. Blaschke, M. Lumpkin, and D. Hartman, 2020, Clinical Pharmacology & Therapeutics, 107(1), p. 69 (https://doi.org/10.1002/cpt.1680). CC BY 4.0.
At the simplest level, the streams share a similar process
The overall process for prequalification is shown in Figure 2. There is variation between product streams, some of which is captured in the next section (here).

Figure 2: Overview of the WHO-PQ process. Based on “Introduction to medicines inspections technical updates,” by D. K. Mubangizi, 2015, Joint WHO-UNICEF-UNFPA meeting with pharmaceutical and diagnostics manufacturers and suppliers, Copenhagen, Denmark, slide 5 (original URL, archived here).
The following write-up relies heavily on the WHO-PQ website (WHO, n.d.-x). All timeline targets are taken from “Delivering Quality-Assured Medical Products for All 2019-2023” (WHO, 2019), the WHO’s plan to help improve regulatory systems. We have not found any resources that show how WHO-PQ has performed against these, but the “external assessment report” of WHO-PQ impact (“Impact Assessment,” 2019) suggested that overall timelines were “usually one year or less” (p. 23), which seems to be broadly in line with the overall PQ target timelines.
- WHO-PQ invites expressions of interest (EOIs)3
Within each product stream, the WHO program teams define the specific set of products that are eligible for PQ assessment. WHO-PQ then issues EOIs for these products, inviting manufacturers to submit applications (Step 2 below). Manufacturers cannot submit for products that are not covered by an EOI.
Expressions of interest are available on the WHO-PQ website (see WHO, n.d.-e). The invitation can remain open for years; for example, the EOI for finished pharmaceutical products (FPPs) for influenza-specific antiviral medicines was issued in July 2015.
Treatment guidelines and EOIs are manufacturer agnostic. They list products based on specific attributes, such as active ingredient and dosage.4 Any manufacturer of a product that meets this description is eligible to submit an application.
- Manufacturer submits an application
Each product stream lays out the requirements for an application. These requirements can vary based on different parameters. Most importantly, depending on whether previous approval has been granted by another regulatory authority of sufficient maturity,5 WHO-PQ may conduct an abridged assessment, rather than a full assessment.6
WHO-PQ determines what kind of assessment is required, and therefore what information the manufacturer needs to submit. Some product streams encourage or require a pre-submission meeting to streamline this process.
Very generally, an application includes the material needed to evaluate whether the product is safe and effective, and whether it will be produced with high and consistent quality. In addition, information is required to evaluate the suitability of the specific version for use in low- and middle-income country (LMIC) health care settings. We have not found a generalizable list across product streams, but this may include:
- Results and protocols for efficacy testing, either lab validation or field testing7
- Suitability for use in LMICs, e.g., storage stability at high heats
- Appropriateness of labeling and instructions for safe use
- Information about the manufacturing process, particularly quality management systems
- Commercial history of the product
- WHO-PQ assesses the dossier
The first step is to screen the dossier to check all materials are submitted. Missing materials may lead WHO-PQ to request additional information from the manufacturer, resulting in delays. The target for this screening stage is 30 calendar days for first actions; WHO-PQ aims for 80% compliance, i.e., 80% of dossiers are processed within the target time.
WHO-PQ assessors then complete a desk audit of the submission. They may respond to the manufacturer with additional questions.
The target timeline for this part of the process is generally 270 calendar days for a full assessment, and 100 calendar days for the abridged assessment.8 WHO-PQ indicates that they aim for 70% compliance with the target for finished pharmaceutical products, and 30% compliance for active pharmaceutical ingredients (APIs).
For some product streams, such as vaccines, this stage may also involve independent sample testing by the WHO. We have not investigated this further, but this may be worth further research to determine whether this is a source of delays.
- WHO-PQ inspects the manufacturing site
Inspections are scheduled and carried out by the cross-cutting Inspections Services team. The dates of the inspection are provided and agreed on in advance. The aim is to assess whether the site’s quality management systems are consistent with international standards.
The inspection may involve: examination of documents, observation of the production line for the product undergoing prequalification, and interviews with personnel on site. More than one product may be assessed during a single inspection. The outputs from all inspections are made available as WHO Public Inspection Reports (WHOPIRs; see WHO, n.d.-v).
If a site has recently been inspected by a regulatory authority that operates with equivalent standards to WHO-PQ, Inspection Services may “leverage” the outputs of this inspection rather than conducting their own site visit. This page on their website suggests that this would mean conducting a desk audit only (WHO, n.d.-i). Christian Stillson’s (Senior Manager, HIV Diagnostics, Clinton Health Access Initiative) impression from WHO-PQ Diagnostics is that during the pandemic, if a site had been inspected in the last three to five years, WHO-PQ might waive the site inspection entirely, though he assumes the desk audit was still conducted. This may be a temporary measure due to the pandemic.
The target timeline for inspection first actions is 210 calendar days. WHO-PQ aims to meet this timeline at least 80% of the time.
- Product is listed as prequalified
If the assessment and inspection are successful, the product is added to the relevant prequalified list. For example, see the list for FPPs at WHO (n.d.-j).
The product listing indicates which specific manufacturing sites have been approved by WHO-PQ. Note that prequalified products can later be suspended or delisted.
- Post-prequalification activities (maintenance and
monitoring)
Manufacturers are required to report relevant changes to WHO-PQ after prequalification. The target timelines for post-PQ change first actions ranges between 45 and 90 days, depending on the product type and whether the amendment is minor or major. WHO-PQ aims for 80% of cases to meet this timeline.
There are also several mentions of re-inspection, e.g., “every 3-5 years.” We are not clear on how often this actually occurs.
WHO-PQ also conducts other related activities, which we have not prioritized for this report:
- Training programs for medicines regulators and manufacturers. ’t Hoen et al. (2014) report >1,300 participants each year (p. 153).
- Rotations in Geneva for LMIC regulators, for capacity building
- Inspection of quality control labs (specifically under WHO-PQ Medicines)
There are some differences between product streams
There is an additional requirement for vaccine prequalification: WHO-PQ requires the national regulatory authority (NRA) of the “producing country to be functional as a prerequisite for acceptance of submissions from manufacturers from that country” (Dellepiane & Wood, 2015, p. 55).9 The decision to require this was made in 2000, but the medicines program, which was established in 2001 (more here), does not have the same requirement. Dellepiane and Wood (2015) suggest that this is necessary for vaccines but not medicines because of the “complexity and inherent variability” of vaccines, and a lower level of risk for generic medicines (p. 55).
WHO-PQ vector control does not issue Expressions of Interest. Instead, a manufacturer contacts the WHO-PQ team about a given product, and together the WHO program team and WHO-PQ determine the appropriate pathway for prequalification, depending on whether there is an existing WHO policy recommendation for the product type (see WHO, n.d.-c, for more detail).
There are likely to be other differences between product streams, beyond the two that we have identified. Process flows specific to each product stream can be found on the WHO-PQ website: vaccines (WHO, n.d.-n); in vitro diagnostics (WHO, n.d.-f); medicines (WHO, n.d.-k); and vector control products (WHO, n.d.-r).
WHO-PQ was initially created in 1987 for vaccines, and has extended its scope over time
The WHO has a mandate to “develop, establish and promote international standards with respect to food, biological, pharmaceutical and similar products” (“Constitution of the World Health Organization,” 1946, art. 2), and the efforts of the prequalification program fall within this mandate. WHO-PQ was initially created in 1987 to support UNICEF to ensure quality, safety, and efficacy of vaccines. Over time, it expanded to other UN agencies, and other funders, e.g., the Global Fund (GF). It also expanded to medicines (2001) and in vitro diagnostics (2008-2010). In 2001, the Inspection Services team was created. These teams became one program in 2013. In 2017, vector control transitioned from the WHO Pesticide Evaluation Scheme (WHOPES) to WHO-PQ.
The products in scope of each stream have extended over time, as shown in Figure 3.

Figure 3 : Evolution of WHO-PQ over time. From “Twenty-five years of the WHO vaccines prequalification programme (1987–2012): Lessons learned and future perspectives,” by T. F. Blaschke, M. Lumpkin, and D. Hartman, 2020, Clinical Pharmacology & Therapeutics, 107(1), p. 70 (https://doi.org/10.1002/cpt.1680). CC BY 4.0.
Vaccines (1987)
Dellepiane and Wood (2015) give more detail on the history of the vaccines product stream.
In 1974, the Expanded Programme for Immunization (EPI) program began. Procurement agencies — particularly UNICEF and the Pan American Health Organization (PAHO) — rapidly began to buy more vaccines for these programs. For quality assurance, these agencies screened and reviewed vaccines “where possible,” or relied on member states’ testing. In 1987, it was agreed that the WHO would advise UNICEF on what vaccines were acceptable to purchase, and the PQ program began that year.
Medicines (2001)
Similarly, ’t Hoen et al. (2014) give a good summary of the development of the vaccines program. Prior to the establishment of WHO-PQ for medicines, most donors were piggy-backing on the quality assurance mechanisms of UNICEF, Médecins Sans Frontières (MSF) and International Dispensary Association (IDA). As low-cost generic medicines, predominantly produced in India, began to enter the market in the late 1990s, UN Member States requested that the WHO help them to evaluate these products. In 2001, the medicines program was established with an initial focus on finished pharmaceutical products for HIV, TB, and malaria. In 2010, the team began to evaluate active pharmaceutical ingredients as well as finished products.
Other product streams
Given time constraints, we deprioritised more detailed research into the history of the other product streams. However, it is worth noting that according to WHO-PQ’s “History and Mission” page, the early origins of diagnostics prequalification were linked to the fact that HIV assays performed worse in Africa than in Europe or America (WHO, n.d.-h).
WHO-PQ’s budget (approximately $30 million to $40 million per year) is covered primarily by donors and fees paid by manufacturers to prequalify products
We estimate that the annual WHO-PQ budget is $30 million to $40 million (75% confidence)
One expert estimated that the budget for the WHO-PQ team was around $35 million to $38 million. This is lower than we were expecting: in 2016, a “Question and Answers” page for the WHO-PQ financing model suggested annual operating costs of ~$40 million (WHO, n.d.-t), and we would have thought this would increase over time (due to inflation and increasing scope). However, the WHO “Budget & Financing” page suggests that the 2020-2021 biennial budget for “Provision of authoritative guidance and standards on quality, safety and efficacy of health products, including through prequalification services, essential medicines and diagnostics lists” is $70 million (WHO, n.d.-o), meaning the annual budget for all activities in this category (not only PQ) would be $35 million. Taken together, this information suggests a total budget of $30 million to $40 million.10
Our impression is that the WHO-PQ team is fully funded (70% confidence), or close to fully funded (80% confidence) for its current scope.11 It also appears that the rough figures in the following two sections add up to the estimated overall budget.
We have not actively tried to find out how the overall WHO-PQ budget breaks down by team.12 Team size varies, and it seems likely that operating costs reflect staffing. The relevant information we have found in the course of other research is:
- ’t Hoen et al. (2014): medicines budget was $15 million per year, at the time (p. 152).
- Lissfelt and Pasquier (2016): estimated $22 million per year for medicines + diagnostics only, with the medicines budget ~3x as big as diagnostics (p. 19)
- It is estimated that there are roughly 15-20 filled positions in each of the vaccines and medicines teams. Christian Stillson estimates the diagnostics team is under 20 people. Vector control is the smallest team, with about five people (based on past experience).13
55-65 people working in the WHO-PQ product streams (75% confidence) plus an unknown number of staff in the Inspector Services
The majority of funding for WHO-PQ comes from donors, particularly Unitaid and BMGF
Most of the current funding for WHO-PQ comes from donors, which has also been true historically.14 It has been suggested that this is in part because the WHO considers prequalification to be a service to other UN agencies rather than core business, resulting in less WHO funding.
Unitaid has committed $157 million to WHO-PQ between 2006 and 2021 (Unitaid, n.d.). Their early funding focused on medicines, and was later extended to diagnostics. Their grantmaking is restricted to diseases of interest: malaria, TB, and HIV/AIDs. In the past, Unitaid said they funded more than 80% of the prequalification programme for medicines and diagnostics (Lissfelt & Pasquier, 2016, p. vii). While we could not find an estimate of what their annual funding is now, for the 2014-2016 period this was roughly $17 million per year (Lissfelt & Pasquier, 2016, p. 19). If this has remained stable, it would represent 42%-56% of the overall WHO-PQ budget.
The majority of BMGF’s current funding for WHO-PQ is unrestricted, as part of a $34.4 million grant to the Regulation and Prequalification department in 2020 (BMGF, n.d.).15 The grant length is 41 months (~$10 million per year) and it is due to end in early 2024.
Murray Lumpkin, Deputy Director of Regulatory Affairs at BMGF, shared that this is a progression from two rounds of previous grantmaking that were tied to specific activities, reflecting closer relationships, better alignment of goals, and demonstrated ability to perform against previous grant goals. The current grant is a “body of work” grant which gives RPQ management the flexibility to use the funds for almost all of the RPQ activities where the need is greatest; however, RPQ reports to BMGF on all of the RPQ activities. BMGF is already preparing for another four-year grant of similar size, and negotiations should be finalized by the end of the year. BMGF’s financial commitment to RPQ has decreased as the amount of fees collected has increased. Ultimately, BMGF’s aim is for WHO-PQ to become self-sustaining. At present, BMGF is funding ~20% of RPQ’s total budget (including both the PQ team and other teams within RPQ).
Other past contributors have included USAID, and some national governments, e.g., that of the Netherlands (Dellepiane & Wood, 2015, p. 55). We have not spent time specifically looking to see whether such organizations are current donors.
Revenue from fees may cover roughly one-third of WHO RPQ costs
WHO-PQ’s current fee mechanism was introduced in 2017, following work with external consultants that was funded by BMGF. Manufacturers pay to have products evaluated, with fees varying across product streams, as shown in Table 1. A brief history of prequalification fees can be found in Appendix A.
Table 1: Fees for WHO-PQ product streams, as of June 2023.
Dashes indicate that there is no fee.
| Product stream | Screening or dossier evaluation fee | Appli- cation16 | Annual main- tenance | Post-PQ changes | Site inspection | Source |
| Vaccines | $2,500 - $5,000 | $25,000 - $232,750 | $4,800 - $250,00017 | - | $30,000 | WHO (n.d.-d) |
| Immuni- zation devices | - | $600 - $3,200 | $300 - $1,600 | - | - | WHO (n.d.-l) |
| Medicines (FPPs and APIs only) | - | $6,000 - $25,000 | $4,000 - $20,000 | $3,000 | - | WHO (n.d.-k) |
| In vitro diagnostics | $5,00018 | $8,000 - $12,000 | $4,000 | $3,000 | - | WHO (n.d.-m) |
| Vector control | - | - | - | - | - | WHO (n.d.-s) |
As a point of comparison, in FY 2022, the US Food and Drug Administration (FDA) charged $3,117,218 per application requiring clinical data, and $1,558,609 per application not requiring clinical data, as well as $369,413 for prescription drug program fees (FDA, n.d.).
Our discussions with experts suggest that prequalification fees paid by manufacturers amount to around $13 million-$15 million per year, or 30%-35% of RPQ costs.19 The United Nations Population Fund (2019) suggests that the vaccines team is the only product stream that is fully financed by fees. We have not been able to find any other information to support either claim.
Manufacturers may also incur costs to develop products and create dossiers for submission to WHO-PQ and other regulatory authorities.20 These costs can be significant, and may actually be much higher than prequalification fees. As an isolated example, submissions to WHO-PQ vector control require manufacturers to conduct two field trials of efficacy for long lasting insecticidal nets (LLINs); our understanding from past conversations with LLIN manufacturers is that the total cost for these trials is roughly $1 million. In contrast, Christian Stillson suggested that for prequalification of rapid diagnostic tests, the total cost of the required field trials is much lower than $1 million (closer to ~$150,000).
It’s unclear whether WHO-PQ charging fees is ultimately good for access
It’s possible that charging fees for prequalification may actually reduce access to medicines, if these fees deter manufacturers from entering the market or pursuing a listing for these products. The impact could be felt in a number of ways: a) lack of access due to lower total (prequalified) supply, and/or b) lower access given fixed funds due to relatively higher prices. Higher prices could be due to a combination of lack of competition, and the possibility that manufacturers absorb fees into product pricing. Many of these concerns were raised in an open letter to WHO-PQ in 2017, signed by the MSF Access Campaign, amongst others (Global Alliance for TB Drug Development et al., 2017).
Some manufacturers may be more likely to be deterred by fees than others: for example, those who do not expect significant profits.21 In recognition of this, manufacturers of products with low profit margins can apply for a fee reduction or waiver. We have not found any concrete definition of “low profit margins.” The WHO-PQ Medicines website indicates that any applications for a waiver must include evidence of sales and net profits from the preceding year, and lists a number of products that may qualify due to small margins (WHO, n.d.-k). We did not find any published evidence on how frequently waivers have been awarded since 2017. However, experts confirmed that this does happen: in 2022 WHO-PQ waived approximately $1.5 million in fees for medicines, and in response to the pandemic, a total of $11 million in fees was waived.
The WHO-PQ “Funding” page states that the change to a fee-based mechanism “has not impacted negatively,” but does not offer an explanation of what that means or how this has been evaluated (WHO, n.d.-g). We have not found any independent evaluations of the introduction of fees. In ~30 minutes of searching, we did not find information about manufacturers’ views on the current fees. We would expect that this has been captured, but perhaps in documents that are harder to locate during a brief search (e.g., minutes from consultations).
On the other hand, it’s possible that without charging fees WHO-PQ would be financially unsustainable. If it were underfunded, it would likely be understaffed and slower prequalification timelines would reduce access. In the absence of fees, it seems unlikely that BMGF would increase their grantmaking to fill the gap, given that they funded consultants to advise WHO-PQ on how to introduce the fee structure. Given Unitaid’s focus on medicines and diagnostics, it seems likely that vaccine and vector control teams would be most affected.
WHO prequalification speeds up national registration processes, and can guide which products are purchased
Prequalified products almost always also need to be registered by national regulatory authorities
In the vast majority of cases, health products to be used in a given country must be registered for use in that country by the national regulatory authority (NRA). This process is an important part of countries considering products in their specific national context, and being aware of what is on their market legally. Our impression is that it is rare for countries not to require registration of products by their own NRA, though there were more exceptions in the past.22 As an illustrative example, Dellepiane and Pagliusi (2018) report that 106 of 134 countries considered in their study require country registration for vaccines (p. 3394). Our low-confidence impression from general reading is that the exceptions tend to be smaller countries with very limited or no regulatory capacity.
In general, the main issues with country registration are that work is duplicated, and there are long timelines for approval. Application formats and requirements differ between countries, such that manufacturers may have to prepare multiple dossiers for multiple countries.23 After submission, we estimate that the lead time for approval in LMIC NRAs is two years, if a full assessment is conducted by the national agency. This is a conservative (low) estimate, and there is significant variation between countries.24 Our estimate is based on the following:
- Two years comes up often as a rough estimate of average timelines in Eastern Africa (Dellepiane & Pagliusi, 2018, p. 3392; Ngum et al., 2022, p. 4).
- The Coalition for Health Research and Development (CHReaD, 2022) provides a good overview of the Kenyan Pharmacy and Poisons Board target and achieved timelines for registration (pp. 32-35). The target for a full assessment is two years, but the report finds that in 2022, the average time for completion was 33 months. A senior health systems consultant in Kenya additionally mentioned that South Africa takes longer (four years), while Ghana and Egypt take less time (no estimate given).
- According to Sithole et
al. (2021), the approval time in Southern African countries in 2019 and 2020
ranged from 202-890 days (0.5-2.4 years; p. 4).25 Tanzania and Zambia were at the lower end of the
range, while Namibia, Zimbabwe, and South Africa were at the high end.
An estimate of two years does not necessarily include queueing time, (i.e., the time between receipt of the application and the assessment). Targets for these are also lengthy: it appears common for this to be 90 days, while in Namibia the target is reported to be more than a year (Sithole et al., 2021, p.7).
A small number of sources suggest that fees for registration in LMICs are limited, and much lower than in HICs. Patel et al., 2018 report that fees in East and West Africa are well under $10,000, with a range from $0-$3,000 per product (p. 50).26 Ratlabyana (2020) reports that some NRAs in Southern Africa do not charge fees at all (p. 40). A senior health systems consultant in Kenya shared that the Kenyan NRA currently charges local manufacturers $500 per product registration, while international manufacturers are charged $1,000 per product registration. We have not checked these against current costs on NRA websites. This would suggest that costs seem unlikely to be a major deterrent for manufacturers, when compared to the lead time. This is a low confidence conclusion, as it relies on a small number of price points and is not supported by any direct conversation with manufacturers.
The long timelines for country registration are caused — at least in part — by limited resourcing for assessments at NRAs. According to Ngum et al. (2022), across Southern Africa the number of reviewers working at each NRA is between four and 50 (p. 5). Ratlabyana (2020) states that external reviewers or assessors will increase NRA capacity by fewer than 20 people in most cases, though in South Africa the staff is significantly increased by 75 additional external reviewers/assessors (p. 39).27
WHO-PQ’s Collaborative Registration Procedure aims to speed up country registration, as do other harmonization initiatives
The main way that NRAs are influenced by WHO-PQ’s decisions is via the Collaborative Registration Procedure (CRP) for prequalified products.28 This initiative employs the principle of reliance, which the WHO (2021b) describes as a “smarter, more efficient way of regulating medical products in the modern world” (p. 240). Under this approach, countries move away from entirely independent processes, while still maintaining sovereignty over final decisions.
CRP for prequalified products reduces duplicated work and shortens timeframes. An applicant expresses their interest in participating in the program and authorizes WHO-PQ to share information with the relevant countries. WHO-PQ then shares the manufacturer’s submission, as well as the PQ assessment report and site inspection report, directly with those countries.29 The NRA assesses whether they believe CRP is appropriate for this application; if they decline to apply the process, they need to submit a reason to WHO-PQ. Once the process begins, the target timeline is 90 days for a decision, plus an additional 30 days for communication to WHO-PQ and the applicant.
According to a WHO presentation (Azatyan, 2021), it seems that the median application between 2013 and 2020 had a registration timeline of 75-119 days, which is a significant improvement on the estimated two years for independent country registration (slide 16). Independent academic work by Sithole et al. (2021) finds that prequalified generics experience faster country registration in Southern Africa, with a mean approval time ranging from 45-298 days (p. 4), as shown in Table 2.
Table 2: Comparison of mean approval times of new active substances (NAS), generics and WHO prequalified generics 2019–2020 (calendar days). From “Evaluation of the review models and approval timelines of countries participating in the Southern African Development Community: Alignment and strategies for moving forward,” by T. Sithole, G. Mahlangu, V. Capote, T. Sitoie, S. Shifotoka, J. Gaeseb, L. Danks, P. Nkambule, A. Juma, A. Fimbo, Z. Munkombwe, B. Mwale, S. Salek, and S. Walker, 2021, Frontiers in Medicine, 8, Article 742200, p. 4 (https://doi.org/10.3389/fmed.2021.742200). CC BY 4.0.

In addition to the benefit of shortened timeframes, participating NRAs also indicate that the CRP contributes to capacity building for staff (“Impact Assessment,” 2019, p. 45).
Since 2013, the number of products registered via this procedure has been steadily increasing, as can be seen in Figure 4 below. However, the CRP for prequalified products is still limited in scope, as it does not encompass all countries, and is not yet functioning for all WHO-PQ product streams.
According to the WHO, 60 countries and one regional organization currently participate in the CRP (WHO, n.d.-b). However, as of July 2021, only 32 countries were listed as having registered any product through the CRP, as shown in this spreadsheet (archived from WHO, n.d.-b). Participants include Nigeria, the Democratic Republic of Congo, the Philippines, Mozambique, and Ethiopia; notable absences include India and Pakistan.
The CRP for prequalified medicines was established in 2013 and is by far the most advanced. While the vaccines program was established in 2004 according to a WHO presentation (Azatyan, 2021, slide 13), feedback in 2019 suggests that the process for national registration after WHO-PQ listing was not well suited for the specifics of vaccine regulation, and NRAs and manufacturers were not very aware of the program (“Impact Assessment,” 2019, p. 47). While the process has not been used frequently in the past for vaccines,30 this is increasing and the WHO has committed to advocate for its increased use.
There is no formal CRP for diagnostics or vector control yet. A pilot for diagnostics began in 2019 with five countries, but Christian Stillson reported that most countries that are part of the CRP for medicines do not have processes to manage diagnostics. The CRP for vector control is being designed, with help from Innovations to Impact (I2I, n.d.).

Figure 4: Total national submissions approved via CRP for prequalified products. Data from WHO-PQ register (original URL, archived here). Analysis by Rethink Priorities.
We do not have a strong view on whether WHO prequalification can help to speed up country registration outside of the CRP. It’s possible that it does have some effect on NRA evaluators if they see WHO-PQ’s approach as the “gold standard,” as suggested by a senior health systems consultant in Kenya. Ashigbie et al. (2020) try to answer this question quantitatively for antiretrovirals in Ghana and Kenya; the authors find that having WHO-PQ listing does not have a significant effect on registration timelines. However, this may be the result of small sample sizes, and its limited scope makes it difficult to draw generalizable conclusions.
Alongside the CRP, there are many efforts to improve country registration through regulatory harmonization and regionalization, which have shown some impact. Alquier and Richmond (2021) estimate that roughly “85% of Sub-Saharan Africa is involved with one or more medicine regulatory harmonisation projects” (p. 5). Some examples include:
- East African Community Medicines Regulatory Harmonization: under this initiative, countries conduct joint assessments, and multiple estimates suggest that the timelines for this process are under a year, e.g., Ngum et al. (2022, p. 4). After the product is recommended at the regional level, individual countries take up to three months to register the product in their own country.31 For example, the target timeline in Kenya is 90 days (CHReaD, 2022, p. 33).
- ZaZiBoNa: an initiative incorporating 13 Southern African states, in which joint assessments are completed, and non-binding recommendations are made. The target timeline for assessment is nine months, and Sithole et al. (2020) suggest that the median assessment achieves this (p. 1324).
Dellepiane and Pagliusi (2018) also mentions that 23 countries directly accept prequalified vaccines, without country registration (p. 3394). We have not looked into this further.
In practice, prequalification also plays a key role for any countries where products within WHO-PQ’s scope are procured by international donors
Most international procurement agencies use WHO-PQ as a (minimum) requirement for quality assurance (more here). As a result, when products are purchased by international donors, countries end up effectively being guided by WHO-PQ.
In discussion with Alex Bowles (Global Health Senior Program Associate, Open Philanthropy) and Christian Stillson, it appears that almost all vaccines and most HIV diagnostics will fall into this category. From Aisling’s previous experience, the majority of LLINs are also bought by international donors such as the GF and the President’s Malaria Initiative (PMI).
In 2019, MSF staff wrote an editorial highlighting the risk that the importance of prequalification could decrease due to a change in the GF allocation mechanism (Tatay & Torreele, 2019). Amidst a push towards more co-financing by national governments and deprioritization of GF funding for certain countries, governments in LMICs will be expected to procure more health products directly. In countries with less mature NRAs, this could result in poorer quality medicines. They also highlighted that this shift could — and already was — leading to national governments paying higher prices (due to loss of pooled procurement and volume pricing), and stock-outs (where registered options were limited).
Christian Stillson pointed out that other national bodies can play a similar role in limiting options to prequalified products. For example, a Ministry of Health may not recommend a product for use until it is PQ-listed, even if an NRA has registered it.
WHO-PQ covers a small subset of the WHO Essential Medicines List (EML) and guides international donors’ procurement
WHO-PQ covers a small subset of the WHO EML
Based on Coyne (2019, p. 80), ’t Hoen et al. (2014, p. 145), and the WHO-PQ’s most recent five-year plan (WHO, 2019), we feel moderately confident that the overwhelming majority of health products covered by WHO-PQ are a subset of the EML (or EMLc). There may be some exceptions.32
One expert estimated that only 10% of the items on the EML are currently eligible to go through the WHO-PQ process.33 It’s worth noting that this does not mean that WHO-PQ only covers 10% of the disease burden, or 10% of spending on health products. We spent about two hours creating an estimate of how the scope of WHO-PQ maps onto the global burden of diseases (see here). With more time, this analysis could also be extended to show the scope of the WHO-PQ versus the EML.
The WHO-PQ’s plan for 2019-2023 specifically states that their expansion of products eligible for prequalification “will be based on the Essential Medicines List (EML, including vaccines) and the Essential Diagnostics List (EDL)” (WHO, 2019, p. 24). They do not state how much expansion they are considering, or for which product streams.
Major procurement agencies use WHO-PQ for quality assurance
A vast majority of procurement agencies consider prequalification to be a key requirement of their procurement processes. This is clear from major procurement agencies’ websites — see, for example, the Global Fund’s (n.d.-b) website — and a summary of policies for a number of agencies in the “external assessment report” of WHO-PQ impact (“Impact Assessment,” 2019, pp. 19-21).34 Note that procurement agencies may have additional tender requirements on top of prequalification, but it is generally a minimum requirement.
Most procurement agencies, like the GF, also procure products that have been approved by a stringent regulatory authority (SRA), such as the US Food and Drug Administration.35 Agencies may also purchase products that are not prequalified or approved by an SRA. In these cases, it seems that many of them defer to other mechanisms like the Expert Review Panels hosted by the Quality and Safety of Medicines department of the WHO (see Global Fund, n.d.-a).
Extra funding might increase the effectiveness of WHO-PQ in a number of ways
At the end of the research process, we spent a small amount of time thinking about the question of how WHO-PQ could be better resourced, and what impact this might have. The aim was to capture a variety of low-confidence ideas, rather than to fully vet solutions for tractability or cost-effectiveness. Most of the ideas are from first principles, rather than backed by the literature. The sections are arranged from most to least developed.
More resources could make more products eligible for prequalification
As discussed above, over time, the scope of WHO-PQ product streams has increased, making more products eligible for prequalification. More funding could lead PQ to expand its scope — by issuing more EOIs — or even establish new product streams.
This could stimulate the market for those products, introducing new low-cost manufacturers and ultimately increasing access. The quality of medicines in these categories may also increase if WHO-PQ has a general effect of improving manufacturing quality, as suggested by the External Assessment Report of WHO-PQ impact (“Impact Assessment,” 2019, p. 51).
At present, WHO-PQ’s scope is limited. We spent around two hours mapping this scope against the Global Burden of Disease’s DALY estimates by cause in this spreadsheet. Our initial estimate is that WHO-PQ currently covers 48% of global DALYs, and 57% of DALYs in LMICs. This is very likely to be an overestimate, given our methodology (see Appendix B). An 80% confidence interval on these estimates would be very wide, e.g., 30%-60%.
An expansion of WHO-PQ to new products seems to be almost universally desired. This is a priority in the WHO’s most recent five-year plan to strengthen regulatory systems (WHO, 2019), and the WHO Director General has also called for this (Blaschke et al. 2020, p. 69). According to Lissfelt and Pasquier (2016): “A top wish expressed by NRAs is for PQ to expand their scope of products” (p. 17).
Experts shared that there have been efforts to fund an expansion of the PQ team before, but the barrier to this is the WHO headcount freeze. While we have not been able to verify this elsewhere, this is a plausible situation where member states are frustrated by the costs and perceived inefficiencies of the WHO, including the high cost of hiring staff in Geneva.36 As a result, requests to hire new staff for teams at WHO headquarters in Geneva, rather than expanding regional offices, are often denied.37 It’s not clear whether this situation will change as Member States increase their contributions to the WHO, increasing its overall budget.
More resources could speed up access to products
Prequalification and country registration are lengthy processes. A full PQ assessment is estimated to take roughly a year, while country registration can easily take two years if not supported by collaborative procedures. Below we have included a list of ways that funding might speed up each process.
Speed up the prequalification process
- Identify whether the bottleneck is desk assessments or inspections, and fund additional staff in the relevant team
- Increase the use of abridged assessments, e.g., by funding staff to make this process easier, or ensuring data sharing agreements are in place with as many NRAs as possible
Speed up country registration (for prequalified products)
- Increase the use of CRP by increasing the number of countries involved
- Fund specific staff to implement the CRP in relevant NRAs and other related departments, e.g., MoH
- Fund sessions where current users share the benefits with non-users
- Increase use of CRP across product streams at WHO-PQ
- Fund specific staff in WHO-PQ to facilitate CRP, either by designing new programs or administrating existing programs
- Improve processes in specific NRAs that lag behind target timelines (where
disease burden is high)
- Fund efforts to provide standardized templates (Sithole et al., 2020)
- Fund systems to allow for automated and real time tracking (Sithole et al., 2020).
- Move systems online (if still paper-based)38
- Support regionalization efforts, whereby approval in one country reduces
timelines for registration in others (by either triggering automatic
recognition, or an abridged registration process)
- Support regionalization efforts, such as the African Medicines Agency (see International Federation of Pharmaceutical Manufacturers and Associations, n.d.)
- Fund staff at the faster NRAs within a region, e.g., Tanzania for the EAC MRH
- Fund staff at NRAs specifically to conduct joint assessments as part of regional efforts
- Increase use of CRP and regional bodies such as EAC by increasing awareness among manufacturers, e.g., by funding communication or meetings
We have not researched the extent to which these processes can be conducted in parallel.
More resources could increase the number of applications to WHO-PQ
If further research finds that the costs of prequalification are keeping manufacturers from applying to WHO-PQ, then more funding could support these manufacturers to make applications. These costs could either be fees charged directly by WHO-PQ, or the indirect costs of needing to develop the application.
In the case of fees, an alternative might be to charge fees to procurement agencies like the Global Fund, who rely on WHO-PQ. This would need to be evaluated carefully, as this could also have impacts on access.
The need for fees could also be reduced if the WHO was to directly fund a larger percentage of the RPQ budget, and recognize the work of RPQ as “core” WHO work.
More resources could improve quality control
This is not an option that we have considered in detail, but it seems possible that improving WHO-PQ could lead to higher quality control and reduce the percentage of substandard or falsified products that reach countries. Doing so would improve outcomes for users with access to these products.
From our previous work with LLINs, we are aware that the WHO-PQ vector control team are currently reviewing the requirements for product submission, and are likely to increase the amount of detail needed in dossiers.
Similar approaches might include requiring more site inspections, or more post-prequalification follow-up or reporting. However, this may be difficult to achieve if pursued alongside reducing timelines or expanding the scope of WHO-PQ, as they would require more financial and human resources.
What we could do with more time
- Refine the estimate of proportion of DALYs covered by WHO-PQ scope (see more here)
- Investigate the impact of WHO-PQ fees on manufacturers — does it impede
access?
- Try to find data on the number of applications to WHO-PQ over time, or the number of stockouts in LMICs over time, and see if it changed in 2017 when fees were introduced
- Understand costs of creating an application for WHO-PQ for a range of products
- Understand how WHO-PQ makes decisions about which EOIs to issue, and how to
add new products or product streams
- For example, a case study for a particular product. The recent extension to insulin might be interesting; however, one expert we spoke to suggested that this has not been a particularly successful addition
- Investigate country registration for emergency use, which is much faster.
For example, CHReaD (2022) indicates
that Kenya has an emergency use listing procedure, which was mainly introduced
during the pandemic, that targets registration within seven days (p. 33). Is
there any evidence of negative outcomes? What are the costs of doing this?
- An interesting case study may be COVID vaccines in Africa following WHO Emergency Use Listing using a modified CRP process
- Understand more about the critical path for WHO-PQ approvals: are extra staff needed for desk audits or for inspections?
- Evaluate WHO-PQ cost-effectiveness: find more estimates, interrogate those estimates, create a BOTEC
- Evaluate the tractability and neglectedness of options for funding
- Create a side by side list of EML and WHO-PQ to show overlap
- Create a breakdown of spending on health products
- Proportion in categories covered by EML
- Proportion in categories covered by WHO-PQ
- Proportion purchased by donors versus national spending
- Could further break down national spending by NRA maturity
- Increase confidence in timelines for country registration, especially outside of Southern and East Africa
- Further understanding of regional harmonization initiatives — both in areas already mentioned in the report (e.g., Mashingia et al., 2020, an article on the EAC), and geographic areas not covered
- Talk to additional experts, such as:
- Unitaid grant manager: Jackson Hungu
- McKinsey consultant who headed the WHO-PQ fees piece of work: Gaurav Agrawal
- EML expert who had thoughts on PQ expansion: Richard Laing
Contributions and acknowledgments

Aisling Leow researched and wrote this report. James Hu assisted with the DALYs exercise, and edited the client-facing version to transform it into a public-facing report. Tom Hird supervised and reviewed the report. Thanks to Jenny Kudymowa, Melanie Basnak and Marcus A. Davis for helpful comments on drafts, and Adam Papineau for copyediting. Further thanks to Alex Bowles (Open Philanthropy), Christian Stillson (Clinton Health Access Initiative), Murray Lumpkin (Bill and Melinda Gates Foundation), and a senior health systems consultant in Kenya (who preferred not to be named) for taking the time to speak with us. Open Philanthropy provided funding for this project, but it does not necessarily endorse our conclusions.
If you are interested in Rethink Priorities' work, please consider subscribing to our newsletter. You can explore our completed public work here.
References
Alquier, L., & Richmond, F. J. (2021). Streamlining processes – the WHO Collaborative Procedure for Accelerated Registration in Africa. Regulatory Rapporteur, 18(9), 4–7. https://perma.cc/BG82-E6Q2
Ashigbie, P. G., Laing, R. O., Wirtz, V. J., Nkrumah, N., Kemboi, A., & Nwokike, J. (2020). Registration timelines of antiretroviral medicines in Ghana and Kenya. AIDS, 34(7), 1093–1095. https://doi.org/10.1097/QAD.0000000000002514
Azatyan, S. (2021). WHO good reliance practices guidelines to support regulatory decision making. https://perma.cc/G9H4-WGJN
Bill & Melinda Gates Foundation. (n.d.). World Health Organization. Retrieved August 5, 2022, from https://perma.cc/6EYU-VSX7
Blaschke, T. F., Lumpkin, M., & Hartman, D. (2020). The World Health Organization Prequalification Program and clinical pharmacology in 2030. Clinical Pharmacology & Therapeutics, 107(1), 68–71. https://doi.org/10.1002/cpt.1680
Coalition for Health Research and Development. (2022). Evaluation of health products’ regulatory review process in Kenya: Challenges and opportunities. https://perma.cc/Z4L7-CYJ7
Constitution of the World Health Organization. (1946). https://perma.cc/QKQ8-YBUJ
Coyne, P. E. (2019). The World Health Organization Prequalification Programme—Playing an essential role in assuring quality medical products. International Health, 11(2), 79–80. https://doi.org/10.1093/inthealth/ihy095
Dellepiane, N., & Pagliusi, S. (2018). Challenges for the registration of vaccines in emerging countries: Differences in dossier requirements, application and evaluation processes. Vaccine, 36(24), 3389–3396. https://doi.org/10.1016/j.vaccine.2018.03.049
Dellepiane, N., & Wood, D. (2015). Twenty-five years of the WHO vaccines prequalification programme (1987–2012): Lessons learned and future perspectives. Vaccine, 33(1), 52–61. https://doi.org/10.1016/j.vaccine.2013.11.066
Food and Drug Administration. (n.d.). Prescription drug user fee amendments. Retrieved June 5, 2023, from https://perma.cc/PBP7-R76S
Global Alliance for TB Drug Development, Global Health Technologies Coalition, MSF Access Campaign, PATH, & Treatment Action Group. (2017, December 18). Open letter: Ensuring the sustainability and robustness of the quality-assured products market through reconsideration of the prequalification fee structure. https://perma.cc/67KF-LV52
Global Fund. (n.d.-a). Sourcing & management of health products: Quality assurance: Expert review panel. Retrieved August 9, 2022, from https://perma.cc/3YUC-RDXY
Global Fund. (n.d.-b). Sourcing & management of health products: Quality assurance: Medicines. Retrieved August 9, 2022, from https://perma.cc/6JGM-3V3Y
Impact assessment of WHO prequalification and systems supporting activities: External assessment report on programmes in the Department of Regulation of Medicines and Other Health Technologies. (2019). https://perma.cc/4MAS-5AUG
Institute for Health Metrics and Evaluation. (n.d.). GBD compare. Retrieved June 6, 2023, from https://perma.cc/M3GN-6Q96
Innovation to Impact. (n.d.). Country registration. Retrieved June 1, 2023, from https://perma.cc/H3HQ-9R4V
International Federation of Pharmaceutical Manufacturers and Associations. (n.d.). Collaboration, convergence, and regulatory reliance. Retrieved June 1, 2023, from https://perma.cc/B9ME-9VFW
Lissfelt, J., & Pasquier, J. (2016). WHO Diagnostics Prequalification Project (DxPQ) and WHO Medicines Prequalification Project (MPQ) mid-term evaluation. Euro Health Group. https://perma.cc/82ER-PLM4
Mashingia, J. H., Ahonkhai, V., Aineplan, N., Ambali, A., Angole, A., Arik, M., Azatyan, S., Baak, P., Bamenyekanye, E., Bizoza, A., Chamdimba, C., Doerr, P., Fimbo, A., Gisagara, A., Hamad, H., Harris, R., Hartman, D., Kabatende, J., Karangwa, C., … Mukanga, D. (2020). Eight years of the East African Community Medicines Regulatory Harmonization initiative: Implementation, progress, and lessons learned. PLOS Medicine, 17(8), e1003134. https://doi.org/10.1371/journal.pmed.1003134
Ngum, N., Mashingia, J., Ndomondo-Sigonda, M., Walker, S., & Salek, S. (2022). Evaluation of the effectiveness and efficiency of the East African Community joint assessment procedure by member countries: The way forward. Frontiers in Pharmacology, 13. https://doi.org/10.3389/fphar.2022.891506
Patel, M., Patel, M., & Patel, R. (2018). Comparing key registration requirements of generic drugs in East Africa, West Africa, USA & Europe with main focus on Kenya. The Pharma Review, 16(2), 46–50. https://perma.cc/MEC5-GV6T
Ratlabyana, M. B. (2020, November). Transparency in medicines registration decision making: A closer look at National Medicines Regulatory Authorities (NMRAs) within the Southern African Development Community (SADC) region. https://perma.cc/DQ2B-R967
Sithole, T., Mahlangu, G., Capote, V., Sitoie, T., Shifotoka, S., Gaeseb, J., Danks, L., Nkambule, P., Juma, A., Fimbo, A., Munkombwe, Z., Mwale, B., Salek, S., & Walker, S. (2021). Evaluation of the review models and approval timelines of countries participating in the Southern African Development Community: Alignment and strategies for moving forward. Frontiers in Medicine, 8. https://doi.org/10.3389/fmed.2021.742200
Sithole, T., Mahlangu, G., Salek, S., & Walker, S. (2020). Evaluating the success of ZaZiBoNa, the Southern African Development Community collaborative medicines registration initiative. Therapeutic Innovation & Regulatory Science, 54(6), 1319–1329. https://doi.org/10.1007/s43441-020-00154-y
’t Hoen, E. F. M., Hogerzeil, H. V., Quick, J. D., & Sillo, H. B. (2014). A quiet revolution in global public health: The World Health Organization’s Prequalification of Medicines Programme. Journal of Public Health Policy, 35(2), 137–161. https://doi.org/10.1057/jphp.2013.53
Tatay, M., & Torreele, E. (2019). Ensuring access to life-saving medicines as countries shift from Global Fund support. Bulletin of the World Health Organization, 97(5), 311-311A. https://doi.org/10.2471/BLT.19.234468
Unitaid. (n.d.). Support for WHO prequalification of diagnostics and medicines. Retrieved August 1, 2022, from https://perma.cc/D73W-8467
United Nations Population Fund. (2019). Frequently asked questions on WHO/UNFPA prequalification of condoms and IUDs fees. https://perma.cc/2T8K-NBF7
World Health Organization. (n.d.-a). Accelerated registration of FPPs approved by SRAs. Retrieved June 5, 2023, from https://perma.cc/Q8S6-UYP2
World Health Organization. (n.d.-b). Accelerated registration of prequalified FPPs. Retrieved June 1, 2023, from https://perma.cc/UUV9-B94M
World Health Organization. (n.d.-c). Determination of pathway. Retrieved February 22, 2023, from https://perma.cc/MR2U-3DM3
World Health Organization. (n.d.-d). Fees for prequalification. Retrieved June 1, 2023, from https://perma.cc/DT7G-2H4Z
World Health Organization. (n.d.-e). FPPs & APIs eligible for prequalification (“EOIs”). Retrieved February 22, 2023, from https://perma.cc/58Z8-PR6B
World Health Organization. (n.d.-f). Full assessment of an IVD. Retrieved August 11, 2022, from https://perma.cc/VZ8J-PB9D
World Health Organization. (n.d.-g). Funding. Retrieved August 1, 2022, from https://perma.cc/8HCT-GY5Y
World Health Organization. (n.d.-h). History and mission of WHO prequalification. Retrieved August 11, 2022, from https://perma.cc/D62C-GHXE
World Health Organization. (n.d.-i). Inspection services: Medicines. Retrieved August 9, 2022, from https://perma.cc/8F5L-LTGR
World Health Organization. (n.d.-j). Medicines/finished pharmaceutical products. Retrieved February 22, 2023, from https://perma.cc/F3KB-GTDT
World Health Organization. (n.d.-k). Prequalification procedures and fees: FPPs, APIs & QCLs. Retrieved August 11, 2022, from https://perma.cc/38MG-M4HF
World Health Organization. (n.d.-l). Prequalification procedures and fees: Immunization devices. Retrieved June 1, 2023, from https://perma.cc/5FGZ-THC2
World Health Organization. (n.d.-m). Prequalification procedures and fees: In vitro diagnostics. Retrieved June 1, 2023, from https://perma.cc/7V9F-SDQE
World Health Organization. (n.d.-n). Prequalification procedures and fees: Vaccines. Retrieved August 11, 2022, from https://perma.cc/JYU6-MH2F
World Health Organization. (n.d.-o). Programme budget web portal: About: Key figures. Retrieved July 27, 2022, from https://perma.cc/4HJ9-EA9C
World Health Organization. (n.d.-p). Regulation and prequalification. Retrieved February 22, 2023, from https://perma.cc/3ER2-TXYE
World Health Organization. (n.d.-q). Vaccines eligible for WHO prequalification. Retrieved June 2, 2023, from https://perma.cc/PG99-TGRH
World Health Organization. (n.d.-r). Vector control products: Assessment overview. Retrieved August 11, 2022, from https://perma.cc/3J38-NJTX
World Health Organization. (n.d.-s). Vector control products: Prequalification procedures and fees. Retrieved June 1, 2023, from https://perma.cc/9FSV-J45T
World Health Organization. (n.d.-t). WHO prequalification financing model – questions and answers. Retrieved September 30, 2016, from https://perma.cc/5AUL-RX3R
World Health Organization. (n.d.-u). WHO prequalification: What we do. Retrieved February 22, 2023, from https://perma.cc/QZ3U-6VNZ
World Health Organization. (n.d.-v). WHO public inspection reports (WHOPIRs). Retrieved February 22, 2023, from https://perma.cc/7USQ-TFCH
World Health Organization. (n.d.-w). WHO-listed authority (WLA). Retrieved February 22, 2023, from https://perma.cc/4NMB-MR4X
World Health Organization. (n.d.-x). World Health Organization prequalification. Retrieved February 22, 2023, from https://perma.cc/PR8A-WSHD
World Health Organization. (2016). Clarification with respect to a stringent regulatory organization as applicable to the stringent regulatory authority (SRA) guideline. https://perma.cc/QK8T-QHBC
World Health Organization. (2019). Delivering quality-assured medical products for all 2019-2013: WHO’s five-year plan to help build effective and efficient regulatory systems. https://perma.cc/RLA5-4UTF
World Health Organization. (2021a). Abridged prequalification assessment: Prequalification of in vitro diagnostics. https://perma.cc/87BA-FNY5
World Health Organization. (2021b). WHO Expert Committee on Specifications for Pharmaceutical Preparations: Fifty-fifth report (No. 1033; WHO Technical Report Series). https://perma.cc/6TCH-34NK
World Health Organization. (2022a). 20th invitation to manufacturers and suppliers of medicinal products for HIV infections and related diseases to submit an expression of interest (EOI) for product evaluation to the WHO Prequalification Unit – Medicines Team. https://perma.cc/L9J4-VLSB
World Health Organization. (2022b). List of national regulatory authorities (NRAs) operating at maturity level 3 (ML3) and maturity level 4 (ML4) (as benchmarked against WHO global benchmarking tool (GBT). https://perma.cc/FB2Q-3V38
Appendix A. A brief history of WHO-PQ fees
According to WHO-PQ, fees for prequalification began at different times for different products: vaccines in 1999, diagnostics in 2008, and medicines in 2013.
- Prior to this, the vaccines program was funded by UNICEF. Dellepiane and Wood (2015) suggest that the initial fees for vaccines were calculated as a percentage fee of each purchase order (p. 55).
- Medicines and diagnostics were funded by BMGF and Unitaid.
Fees were updated in 2013. According to Lissfelt and Pasquier (2016), the fees introduced were much lower than the current fees (p. 22). By their estimate, a projected total revenue of ~$2 million per year would be much lower than total operating costs.
Table A1: WHO-PQ fees by product type in 2016 versus 2023. 2016 fees from “WHO Diagnostics Prequalification Project (DxPQ) and WHO Medicines Prequalification Project (MPQ) mid-term evaluation,” by J. Lissfelt and J. Pasquier, 2016, Euro Health Group, p. 22 (https://perma.cc/82ER-PLM4). 2023 fees from Table 1.
| Product type | 2016 | 2023 |
| FPP | Up to $8,000 | Up to $25,000 for assessment, additional annual costs |
| API | Up to $8,000 | Up to $25,000 for assessment, additional annual costs |
| Vaccine | Up to $67,000 for assessment
Up to $16,800 annual maintenance |
Up to $237,750 for assessment
Up to $250,000 annual maintenance |
| Diagnostics/Devices | Up to $12,000 | Up to $17,000 for assessment, additional annual costs |
In 2014, BMGF funded McKinsey to do a piece of work on fees. According to Lissfelt and Pasquier (2016), the aim was to generate ~50% of the WHO-PQ budget (p. vii). They suggest that McKinsey’s preferred option was for WHO-PQ to charge 1% of sales, but manufacturers and some donors objected. An example of some pushback can be found in an open letter to WHO-PQ in 2017, signed by the MSF Access Campaign, amongst others (Global Alliance for TB Drug Development et al., 2017).
WHO-PQ ultimately defined a new model with flat fees that were much higher than previously. Based on the 2016 “Question and Answers” page for the WHO-PQ financing model, the expectation was that the new fee model would generate ~$20 million annually, covering half of PQ’s operating costs (WHO, n.d.-t).
Medicines and vaccines moved to the new model in January 2017, and in vitro diagnostics in August 2018. The stated intention was to review these fees after three years of implementation. Comparing the originally stated costs (see WHO, n.d.-t) to current pricing (see links in Table 1), almost all prices are exactly the same.
Appendix B. Methodology for mapping WHO-PQ scope to DALYs
DALY data is from the Global Burden of Disease heatmap, found here. We used a “GBD Level 2 Cause” breakdown of the data. These are very high level disease categories.
Information about WHO-PQ’s scope was primarily based on Figure 1 of this report, supplemented by the WHO-PQ Vaccines website to identify the 24 priority diseases (WHO, n.d.-q). While we captured some of the extensions of WHO-PQ scope since January 2019, for example the inclusion of insulin, this attempt has definitely missed others. We made the decision to exclude any diseases that would be covered by WHO-PQ’s pilot in biosimilars, more notably cancer. This reflects our conversation with an expert who described WHO-PQ’s work as a pilot to show they could manage biosimilars, rather than an extension into cancer per se.
When mapping WHO-PQ scope to GBD disease categories, we used very minimal requirements to classify an entire category as covered by WHO-PQ. Specifically:
- We required overlap for only one disease, and one product stream in WHO-PQ. For example, the entire “other infectious diseases” category is classified as covered by WHO-PQ based on the fact that diphtheria vaccines are eligible for prequalification.
- We did not cross-check with the medicines, vaccines, diagnostics, and vector control products actually on the prequalified list. It’s possible that even though a disease is within WHO-PQ’s scope, there are no prequalified products — either because no applications have been made for relevant products, or all applications are still being evaluated.
As this was a very quick piece of analysis, we did not have time to investigate which of these contribute more to our overestimate.
Extensions to this analysis could: use lower level disease categories, use more up to date information about the scope of WHO-PQ, make separate assessments for different product streams.
Notes
-
We have not interrogated either of these estimates, and the difference may in part be due to the methodology used by each. ↩
-
The figure lacks information about what the “24 priority diseases” covered by the vaccines product stream are. The best source for this is WHO (n.d.-q). ↩
-
In full, this is an “Invitation to Manufacturers to Submit an Expression of Interest for Product Evaluation.” ↩
-
As an example, see the April 2022 EOI for FPPs for HIV/AIDS (WHO, 2022a). ↩
-
We briefly looked into which regulatory authorities qualify, and it seems that this may vary by product stream (or even within a product stream). Considering guidance documents published by the WHO-PQ medicines and diagnostics streams, the regulatory authorities of Australia, Canada, the EU, Japan, and the US qualify for both; additionally, Iceland, Liechtenstein, Norway, Singapore, and Switzerland are mentioned for one but not both (WHO, 2016; WHO, 2021a, p. 4). We have not looked at the documentation for vaccines or for vector control. It’s unclear how often new regulatory agencies are added to the list. ↩
-
The majority of assessments conducted by WHO-PQ are full assessments. The clock starts once the application has been screened and found to be complete. ↩
-
Most medicines that go through PQ are generic versions of originator products already authorized by stringent regulatory authorities. In these cases, PQ assesses the bioequivalence of the generic version to the originator version. ↩
-
This is longer for IVDs using “the alternative laboratory mechanism”: 350 days and 180 days. Vaccines also have a “streamlined” process of 90 days. ↩
-
A “functional” NRA is defined as a WHO-listed authority (WLA; see WHO, n.d.-w) operating at maturity level 3 or higher, specifically for vaccine production. The WHO assesses the maturity level of an NRA against a Global Benchmarking Tool, and awards a maturity level between 1 (low) and 4 (high). This system is relatively new, and has not assessed the more mature agencies that operate in places such as the US, EU, and Canada. These appear to generally be assumed to be at maturity level 4. See WHO (2022b) for the November 2022 list of all NRAs operating at maturity levels 3 and 4. ↩
-
Rethink Priorities simultaneously produced two reports: on WHO prequalification and the WHO Essential Medicines List. To the best of our knowledge, both of these teams contribute to the same output, in which case this would suggest a total biennial budget of $70 million, and an annual budget of $35 million. Our current estimate for the two together is $40 million-$50 million per year. We are aware that this is inconsistent, but have deprioritized further refinement for this mini-shallow. ↩
-
By fully funded, we mean that the budget is covered by a combination of fees, money from WHO, and money from donors. While there is a gap for the relevant “outcome” on the WHO “Budget & Financing” page (WHO, n.d.-o), this also includes other teams and does not necessarily reflect the RPQ department’s status. ↩
-
The “external assessment report” also includes a breakdown of 2013 operating costs into variable, fixed, and indirect costs (“Impact Assessment,” 2019, p. 36). However, we did not find this helpful, particularly given its age. ↩
-
Aisling’s direct interaction with members of the WHO-PQ team during three years at the Against Malaria Foundation. ↩
-
According to Dellepiane and Wood (2015), early funding for the WHO-PQ vaccines team relied primarily on UNICEF (p. 55). According to ’t Hoen et al. (2014), in 2013, BMGF and Unitaid were providing 80%-90% of the total budget (p. 155), though it’s not clear if this was the budget for all of WHO-PQ, or just medicines. ↩
-
As mentioned above, this includes both Prequalification and Regulation Systems Strengthening. In addition to this, BMGF have also made other small grants, most recently to support prequalification of covid vaccines by hiring additional assessors or consultants to help with the large number of applications that were received. ↩
-
This range is wide, as it includes both full and abridged assessments. ↩
-
Fees depend on the value of PQ-enabled sales and complexity of vaccine. ↩
-
Only for full assessments. ↩
-
It was not possible for us to determine whether this translates directly to 30% of the WHO-PQ budget, or if the proportion is higher or lower. ↩
-
This may not be relevant for generic products. ↩
-
Smaller manufacturers for which fees represent a large investment may also be deterred. Prior to introducing fees in 2017, the “Question and Answers” page for the WHO-PQ financing model indicated that at the time there were only two to three manufacturers that would be affected, and WHO-PQ was open to deferring fees (WHO, n.d.-t). While fees may have prevented other small manufacturers from entering the market, given that economies of scale are likely to be key for low-cost products, this seems less important than ensuring larger low-profit manufacturers are not deterred. ↩
-
Many countries in the past did not have regulatory agencies or routinely allowed products under “import permits.” ↩
-
Dellepiane and Pagliusi (2018) find that formats for vaccine applications are >70% different. ↩
-
One of the challenges when estimating timelines is the lack of clear differentiation between a) time when the NRA is actively working on the assessment, versus b) time waiting for manufacturers to respond to questions, known as “clock stop” time. A conversation with a senior health systems consultant in Kenya suggested that this is likely due to lack of differentiation in data collection: some NRAs may be able to report total time taken, but lack automated tracking systems to record steps within the process. ↩
-
The figures quoted are for generic products. ↩
-
This source may be outdated, as it quotes a fee of $1,000 for Kenya. ↩
-
It’s unclear whether these external staff actively take on assessments, or if they check over completed assessments. If the latter, they may not address the underlying resourcing issue. ↩
-
This is separate to the collaborative registration procedure using stringent regulatory authorities; see also WHO (n.d.-a). ↩
-
It was flagged to us that requiring a WHO-PQ assessment report and inspection report effectively means that abridged assessments (as mentioned here) cannot qualify for CRP. For abridged vaccine and diagnostic assessments, the WHO can get the needed reports from stringent regulatory authorities, but this can be more difficult for medicines. Regardless, abridged assessments are currently the minority of PQ’s workload. ↩
-
This is also somewhat supported by the fact that there is no information about the CRP on the WHO-PQ vaccines page. ↩
-
Also see Ngum et al. (2022) for a good diagram of the process (p. 3). ↩
-
Coyne (2019) suggests these are likely to be covered by relevant WHO guidelines for specific conditions (p. 80). ’t Hoen et al. (2014) suggest that, for medicines, the manufacturer would also need to have applied for the product to be added to the EML (p. 145). ↩
-
Richard Laing, another expert interviewed for the WHO EML report, suggests that it is less than 10%. ↩
-
Including UN agencies, Gavi, Red Cross, the Global Fund, Unitaid, MSF, CHAI, and Elizabeth Glaser Pediatric Aids Foundation. ↩
-
Stringent regulatory authorities are a subset of NRAs defined by the WHO and GF to have high enough standards to support procurement. This term is due to be replaced by the new WHO Listed Authority classification, as described earlier in the report. The relative importance of PQ versus SRA approval varies by disease area. For example, tuberculosis and malaria health products are very rarely used in countries that have SRAs, and as such, prequalification is usually the relevant minimum requirement. Additionally, manufacturers may choose not to market products with SRA approval in LMICs, and instead this market is catered to by generics that need to be assessed by WHO-PQ. ↩
-
We spent ~15 minutes on this online. It feels likely that confirming this would require a conversation with someone from the WHO. ↩
-
This may mean that staff could more easily be added to the Inspection Services team, who may not need to be based in Geneva, than the product streams. ↩
-
We don’t know how common this is, but one source suggests that the move in Kenya has been recent and helpful: “The overall shift from manual to online submissions of dossiers and other interactions with [the Kenyan NRA] has been a huge achievement in the past few years. This has reduced the issues of submitted dossiers getting lost and made the application process easier” (CHReaD, 2022, p. 36). ↩