
Quantifying and prioritizing shrimp welfare threats
Shrimp welfare research at Rethink Priorities
Rethink Priorities’ Shrimp Welfare Sequence is a series that addresses whether and how best to protect the welfare of shrimp. At any time, more shrimp are alive on farms than any other group of farmed animals. This is the fourth report in the sequence. Previous reports estimated shrimp pre-slaughter mortality rates and overviewed the welfare threats shrimp face. This report quantifies the pain caused to shrimp by 18 welfare threats, using the Welfare Footprint Project's framework.
For all queries, please contact hannah@rethinkpriorities.org.
Citation: McKay, H. and McAuliffe, W. (2024). Quantifying and prioritizing shrimp welfare threats. Rethink Priorities. https://doi.org/10.17605/OSF.IO/4QR8K
Executive summary
This is the fourth report in the Rethink Priorities Shrimp Welfare Sequence. In this report, we quantify the suffering caused to shrimp by 18 welfare threats to assess which welfare issues cause the most harm.
See a complete description of the methodology here. We focused on penaeid shrimp in ongrowing farms and broodstock facilities. Incorporating uncertainty at each step of the model, we estimated the prevalence, intensity, and duration of pain caused by each welfare issue. The intensity was based on the Welfare Footprint Project’s Pain-Track categories, and ‘pain’ refers to their definition of pain, encapsulating both physical and mental negative experiences (Alonso & Schuck-Paim, 2024a). We collapse different pain type estimates into a single metric: ‘Disabling-equivalent pain’. See the results in Figure 1.

The average farmed shrimp spends 154 hours in disabling-equivalent pain (95% Subjective Credible Interval (SCI): [13, 378]). If we assume that 608 billion penaeid shrimp die on ongrowing farms annually (i.e., including those that die pre-slaughter; Waldhorn & Autric, 2023) then mean values imply that they experience 94 trillion hours of disabling-equivalent pain a year (95% SCI: [8 trillion, 230 trillion]).
The highest-ranking threats are chronic issues that affect most farmed shrimp. The top three are high stocking density, high un-ionized ammonia, and low dissolved oxygen. Threats ranked lower are broadly acute, one-off events affecting only a subpopulation (e.g., eyestalk ablation, which affects only broodstock). However, the credible intervals are too wide to determine the rank order of most welfare issues confidently.
Box 1: Shrimp aquaculture terminologyThe terms ‘shrimp’ and ‘prawn’ are often used interchangeably. The two terms do not reliably track any phylogenetic differences between species. Here, we use only the term “shrimp”, covering both shrimp and prawns. Note that members of the family Artemiidae are commonly referred to as "brine shrimp" but are not decapods and so are beyond the present scope. We opt for the use of Penaues vannamei over Litopenaeus vannamei (to which this species is often referred), due to recognition of the former but not the latter nomenclature by ITIS, WorMS, and the Food and Agriculture Organization of the United Nations (FAO) ASFIS List of Species for Fishery Statistics Purposes. The shrimp farming industry uses many terms usually associated with agriculture—for example, ‘crops’ for a group of shrimp reared together, ‘seed’ for the first shrimp stocked into a pond, and ‘harvest’ for collecting and slaughtering shrimp. For clarity, we broadly conform to this terminology. Although we acknowledge animal welfare advocates may prefer terminology that does not euphemize or sanitize the experience of farmed shrimp, here we favor ensuring readability for a wide audience. |
|---|
Introduction
We began the Shrimp Welfare Sequence by asking whether the Animal Sentience Precautionary Principle (Birch, 2017, p. 3) justifies implementing reforms in shrimp aquaculture. The first three posts collectively provide an affirmative answer:
- More shrimp are alive on farms than any other farmed taxa
- Half of them die before slaughter, suggesting that some of the welfare threats they endure must be serious.
- The welfare threats shrimp experience are varied, ranging from poor water quality to environmental deprivation to inhumane slaughter.
Unfortunately, it is probably not possible to address all of these welfare threats at once. Not only do different problems require different solutions, but some issues are likely easier to solve than others. However, tractability is not the only factor to consider when prioritizing which welfare threats to address first. Some issues may be so large in scale that they are worth tackling right away, even if that requires confronting major barriers. Conversely, some issues may be relatively easy to address but also cause relatively less suffering.
This report aims to identify the welfare threats that cause the most suffering to farmed shrimp in aggregate.
We assess only the ongrowing stage of shrimp farms and broodstock facilities (which begins at the postlarval stage and ends at slaughter) because the vast majority of research and on-farm surveys are conducted at this production stage. Hatcheries (which supply ongrowing farms) are less studied and larvae have different welfare requirements (Pedrazzani et al., 2023), so they would require their own assessment for pain quantification.
We focus on penaeid shrimp because there is more research on their welfare and they make up the majority of farmed individuals. However, since Macrobrachium shrimp also make up a non-trivial fraction of production, we would welcome future research that applies our methods to Macrobrachium shrimp.
Method and model specification
A complete description of the methodology is available in our separate methods document and you can download our code from our GitHub repository.
We evaluated 18 welfare threats. We model three dimensions to estimate the aggregate suffering caused by each welfare issue:
- Prevalence: the number of shrimp affected by the issue. This can be determined by multiplying the percentage of farms where the issue is present by the number of shrimps on those farms. Both the percentage of farms implicated and the number of shrimp affected on implicated farms will vary systematically along the extensive–intensive production continuum.
- Duration: the amount of time that the issue negatively affects shrimp when it is present. Because our investigation is limited to suffering while shrimp are still alive, we treat the period after death as free of negative welfare (see Model limitations).
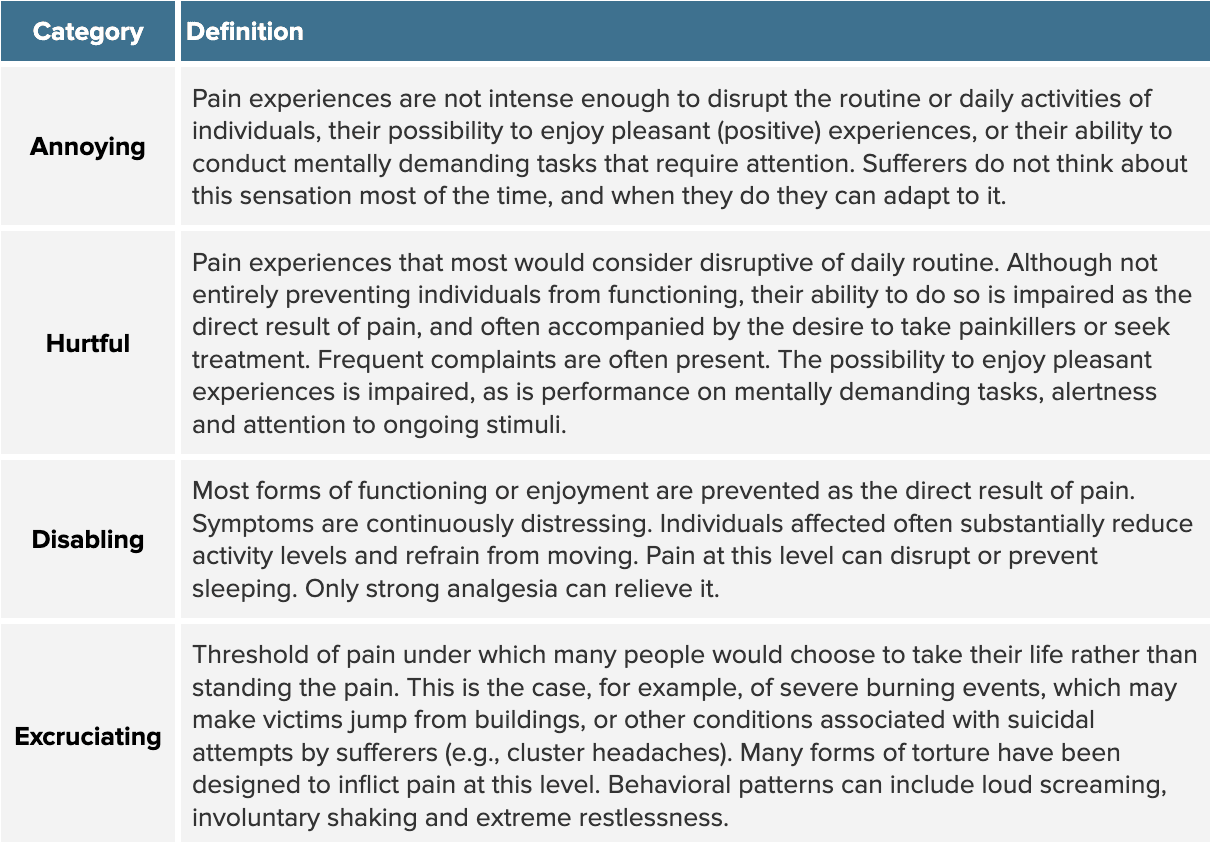
- Intensity: the magnitude of the suffering experienced at a given moment. Alonso and Shuck-Paim (2021) provide a framework for categorizing the severity of pain, roughly according to the opportunity cost of ignoring it for the fitness of the animal. The categories are Annoying, Hurtful, Disabling, and Excruciating.
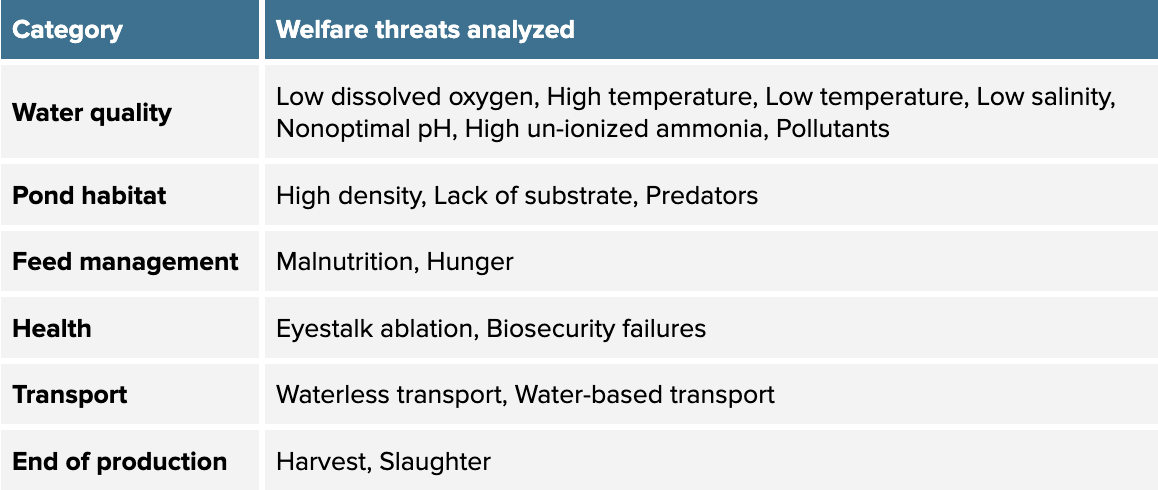
We give our numerical estimates for each welfare issue's prevalence, intensity, and duration in the Appendix. The justification for each model parameter is in our separate methods document. The welfare threats analyzed are available in Table 1.
Table 1: The six broad categories and 18 welfare threats analyzed in our model.
Why these welfare threats and not others? Threats vary in how proximate they are in the causal chain of events that eventually terminates in producing aversive experiences. For example, a genetic predisposition that later causes suffering is relatively distal compared to a water quality parameter like ammonia reaching toxic levels. Furthermore, whether a welfare threat can be controlled or mitigated depends on who the stakeholder is and the production stage. For example, broodstock suppliers have some control over the genetics of the shrimp they sell, but they do not have control over how the farmer treats the shrimp.
Since we are aiming to understand which welfare threats are most urgent, we focus only on threats that can be intervened upon. As such, in choosing which variables to include and how to interpret their effects, it is necessary to clarify what the stakeholder of interest is capable of exogenously manipulating at a certain stage of the production process.
Our model is from the perspective of farmers who have just stocked their ongrowing ponds or tanks and broodstock suppliers who are deciding whether to ablate and transport broodstock. Note that this deviates from the Welfare Footprint Project’s method—we evaluate suffering and build Pain-Tracks at the level of circumstances (e.g., high temperature) rather than affective states (e.g. pain from heat stress). While the latter may produce a more fine-grained analysis, it would have been impractical in our case due to the lack of data on shrimp behavior and affective experiences. Moreover, our aim was not to understand what type of pain shrimp suffer from most over their life (e.g., weakened immune system, behavioral deprivation, etc.) but to understand which controllable practices are causing the most harm. Analyzing at the circumstance level means we do not need to understand the multiple determinants of any given pain type to appreciate which interventions may alleviate the most suffering.
We also excluded some welfare threats that are manipulable by farmers, but where scientific evidence was too scarce to develop reasonable pain estimates. First, we could not determine whether the absence of live food frustrates shrimp by depriving them of predation opportunities that may be experienced as rewarding. That said, nutrient deficiencies and refusing non-preferred foods would be covered by ‘malnutrition’ and ‘underfeeding,’ respectively. Second, the literature on environmental enrichment lacked information on whether shrimp actively dislike certain colors or simply prefer others. Positive welfare goes beyond the pain-based framework we use in this model (though the Welfare Footprint Project has recently developed a framework for evaluating positive affective states; Alonso & Schuck-Paim, 2024b).
Analytic Approach
We do not have access to population parameters about the number of shrimp affected by a threat for any of the variables of interest. In some cases we have access to surveys of farmers and can make inferences, assuming they are representative of a certain geographical region. In other cases, we can only make guesses about prevalence, duration, and intensity, by cobbling together clues from the aquaculture literature.
As a result, we aim to model our best guesses using 90% subjective credible intervals (SCIs). SCIs can be derived by trimming 5% from the high end as well as the low end of a density distribution. We generate these distributions using a Monte Carlo simulation approach. In essence, we specify the shape of the distribution and its first two moments and then draw 100,000 samples from it. The resulting distribution represents our confidence about what the true value of the parameter might be. Each welfare threat has three distributions: Prevalence, duration, and intensity.
Prevalence
Prevalence can be interpreted as the percentage of farms of a given farm type that experience the issue on any given day. We often inferred this by estimating the extent to which different farm types (extensive, semi-intensive, intensive, and super-intensive) use a welfare-inhibiting practice. We then multiplied this by the probability that a shrimp came from each farm type. According to Boyd et al. (2021), the proportion of production attributable to each farm type was: extensive 11.5%; semi-intensive 16.7%; intensive 71.8% (we assume super-intensive was <1%). We accounted for this data being outdated, for pre-slaughter mortality varying across these farm types, and for the trend toward intensification by adding random noise around the following estimates:
- Extensive: 11.2%
- Semi-intensive: 16.4%
- Intensive: 71.4%
- Super-intensive: 1%
If a welfare threat only occurs for a subset of the farmed shrimp population, we also weighted the prevalence by an estimated proportion of shrimp in this subset (with uncertainty included). This was the case for eyestalk ablation (which only happens to female broodstock), waterless transportation (broodstock and shrimp sold live), harvest (only shrimp that make it to slaughter age), and slaughter (only shrimp that make it to slaughter age and do not die during harvest).
Duration
Duration is measured either as the hours a welfare threat occurs per day (for frequently occurring welfare threats) or as the total hours throughout the whole production cycle (for one-off events). Where we think duration varies with farm type, we modeled duration distributions for each farm type. For frequently occurring welfare threats, we multiplied the duration distribution with a distribution of shrimp life spans, which accounts for pre-slaughter mortality, and used data from Monte Carlo estimations by Waldhorn and Autric (2023) and McKay and McAuliffe (2024).
This means that an assumption inherent in the model is that shrimp experience the same welfare threats in the same way across their development. This is likely somewhat inaccurate for two reasons:
- Sentience, and therefore the capacity for welfare, may not be stable across shrimp development (Mellor, 2019, section 2.5). If sentience develops only when an animal can proactively move in its environment (Farnsworth & Elwood, 2023), we would expect that shrimp become sentient somewhere around the beginning of the postlarval stage (McKay & McAuliffe, 2024). It is theoretically possible that older shrimp are more likely to be sentient (and can realize more welfare than postlarvae).
- Welfare threats likely impact shrimp of different life stages differently. Pedrazzani et al. (2023), for example, give narrower optimal ranges for water quality parameters for postlarvae than they do for adult shrimp, which also means such threats are probably more prevalent for postlarvae (because water quality parameters will more frequently go outside narrower ranges). Postlarvae in general are less resilient to environmental changes, so their pain intensity may also differ from adult shrimp. When environmental standards varied by life stage (e.g., Pedrazzani et al., 2023), we relied on those for juvenile-subadults.
Note that these two reasons affect the accuracy of our pain estimations in opposite ways, where (1) would make our figures an overestimation and (2) would make them an underestimation.
Intensity
Intensity is measured as the proportion of pain within a specific category, reflecting our confidence that a welfare threat falls into that category. This can also indicate the proportion of affected shrimp experiencing a certain severity of pain due to the threat. Alternatively, it can represent the proportion of time a single shrimp endures each type of pain during a specific period.
For each welfare issue, we apportioned pain amongst the Welfare Footprint Project’s pain categories based on the scientific literature and how closely the findings matched the pain category definitions (Table 2).
Table 2: Pain intensity categories from the Welfare Footprint Project (Alonso & Shuck-Paim, 2021)
A simplifying assumption we are making is that the pain category does not vary over the time course of the welfare threat. We partially address this by breaking down certain welfare threats into separate parts when we believe the pain category will likely decrease or increase in proportion over time. However, within those parts, the pain category proportions do not change.
Aggregating results
To measure aggregate suffering in a single metric, the total hours of each pain intensity category need to be added together. However, because intensity is measured on an ordinal scale, it is not clear how much weight to give each category in the sum. We have two solutions to this issue. The first is to leave results disaggregated by intensity category. Beyond epistemic modesty, this approach also has the benefit of making differences in the qualitative nature between different welfare threats more salient. This is the approach recommended by the Welfare Footprint Project. The second solution, and the one we use here, is to assign relative weights. We can assign numbers based on our theoretical best guesses about how bad each category is relative to a reference category, in this case, disabling pain. This approach allows us to compare all issues on a single metric.
To aggregate the pain intensity categories, we draw upon weightings from previous studies (Duffy, 2023, p. 18; Šimčikas, 2022), as well as conclusions from investigating how to weigh the duration and severity of pain against each other (McAuliffe & Shriver, 2022, 2023; Schuck-Paim et al., 2023). The biggest uncertainty is how many orders of magnitude worse excruciating pain is than disabling pain. The weights we used were uniform distribution with the following ranges:
- Annoying: 0.002 to 0.01
- Hurtful: 0.02 to 0.2
- Disabling: 1
- Excruciating: 5 to 1000
To convert the results for the "average" shrimp to the total amount of pain in the aggregate, we multiply the result for the average shrimp by the number of shrimp that die on farms each year.
Model Limitations
Estimating welfare in the aggregate is what enables us to reduce the model parameters to just three dimensions. However, we acknowledge that this simplicity comes at the expense of treating several potentially relevant issues as beyond our scope. These include:
- Positive experiences: We cannot make any statements about the extent to which positive welfare compensates shrimp for the negative experiences they endure. By definition though, Disabling and Excruciating pain are inconsistent with positive experiences. The Welfare Footprint Project has recently created a framework for estimating positive experiences, although they do not recommend combining it with their Pain-Track method.
- The disutility of death: We treat the time in between an unplanned death and the time shrimp would have been slaughtered as free of suffering. Welfare issues do not receive a penalty for causing death; indeed, sublethal problems are in some sense penalized for not causing death. This is inconsistent with frameworks that assign intrinsic disvalue to premature death (e.g., the "fair innings" concept; Williams, 1998). However, it is consistent with ethical frameworks that emphasize valenced experience as the main or only source of moral value, such as hedonistic utilitarianism. Also, lethal issues are much more likely to cause Disabling or Excruciating pain, so they do make a greater contribution to aggregate pain on a per-moment basis while shrimp are still alive.
- The experiences of any single shrimp (the ecological fallacy): The "average" shrimp is a purely hypothetical construct—our results will not necessarily accurately describe the life of any one shrimp. This is especially clear when you consider that some welfare threats only happen to certain subpopulations of farmed shrimp. For example, eyestalk ablation only happens to broodstock (shrimp used for breeding), and harvest and slaughter only happen to shrimp that survive until slaughter age. The Welfare Footprint Project’s ‘Life-Fate’ concept somewhat tackles this issue (Alonso & Schuck-Paim, 2017), but we would have needed more time and greater data availability to apply it here.
Model Interpretation
We assume purely additive relationships between welfare threats. This means that some estimates of time spent in pain can exceed the lifespan of a shrimp.
When modeling the pain caused by different welfare threats, we considered only the first-order effects of the threat. For example, we only model the pain caused to broodstock by eyestalk ablation and not the pain caused to offspring of ablated broodstock, who are often more susceptible to diseases. Some of this pain offspring suffer is estimated in the other welfare threats we modeled, but it is not attributed to eyestalk ablation. Therefore, if the practice of eyestalk ablation decreased, the overall harm from other threats would also likely decrease.
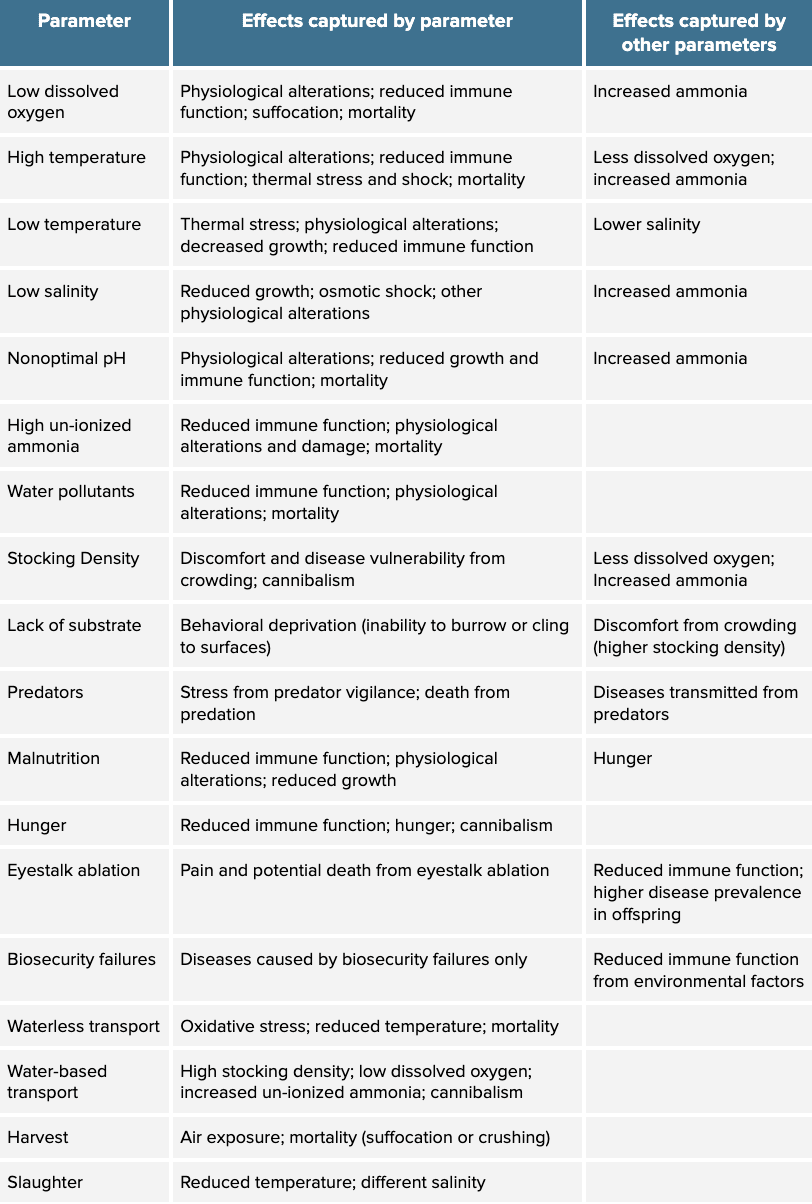
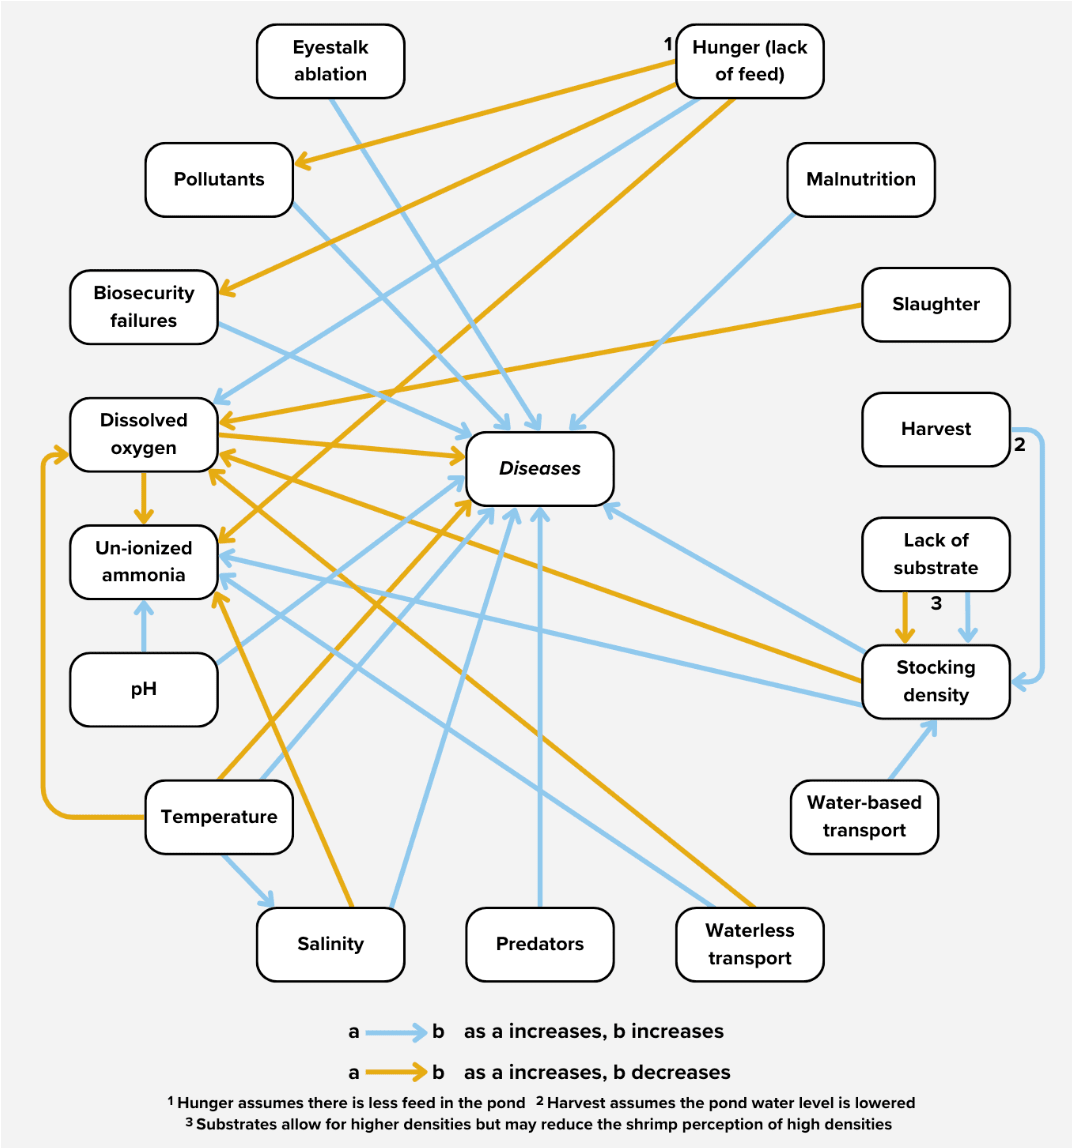
Analogous to a multiple regression model, welfare threats were only held responsible for pain which could not be accounted for by other analyzed threats. For example, even though high stocking densities can cause low dissolved oxygen (DO), the high stocking density welfare threat did not include suffering caused by low DO (which was instead estimated in the low DO threat). Stocking density is only credited for the pain it causes over and above effects in related water quality parameters.
Consequently, interpreting the results requires considering the causal connections between different welfare issues. To aid interpretation, we articulate our interpretations of each parameter in Table 3, based on the causal assumptions depicted in Figure 2.
Table 3: Welfare effects captured by different modeled welfare threats
Evaluating the independent impacts of welfare threats does have some benefits, though.
We avoid double-counting, which allows us to straightforwardly compute the total amount of pain caused by shrimp aquaculture. Also, the parameter estimates show how much good one would achieve by eliminating upstream issues (e.g., high stocking density) if some of the downstream paths by which they cause suffering (e.g., bad water quality) were eliminated by other means (e.g., automatic water quality monitors).
Future researchers could try to get the best of both worlds by separating modeling "direct" effects (i.e., not mediated by any variables included in the model) and "indirect" effects (i.e., at least partially mediated by at least one other variable in the model).
Results
Aggregate Pain
The average shrimp experiences 154 hours (95% SCI: [13, 378]) of Disabling-equivalent pain. Assuming 608 billion shrimp[1] die in the ongrowing stage per year (including slaughter), this means that shrimp aquaculture causes 94 trillion hours of disabling-equivalent pain a year (95% SCI: [8 trillion, 230 trillion]). This could be an underestimate since we do not cover all possible welfare threats or earlier stages of shrimp production.
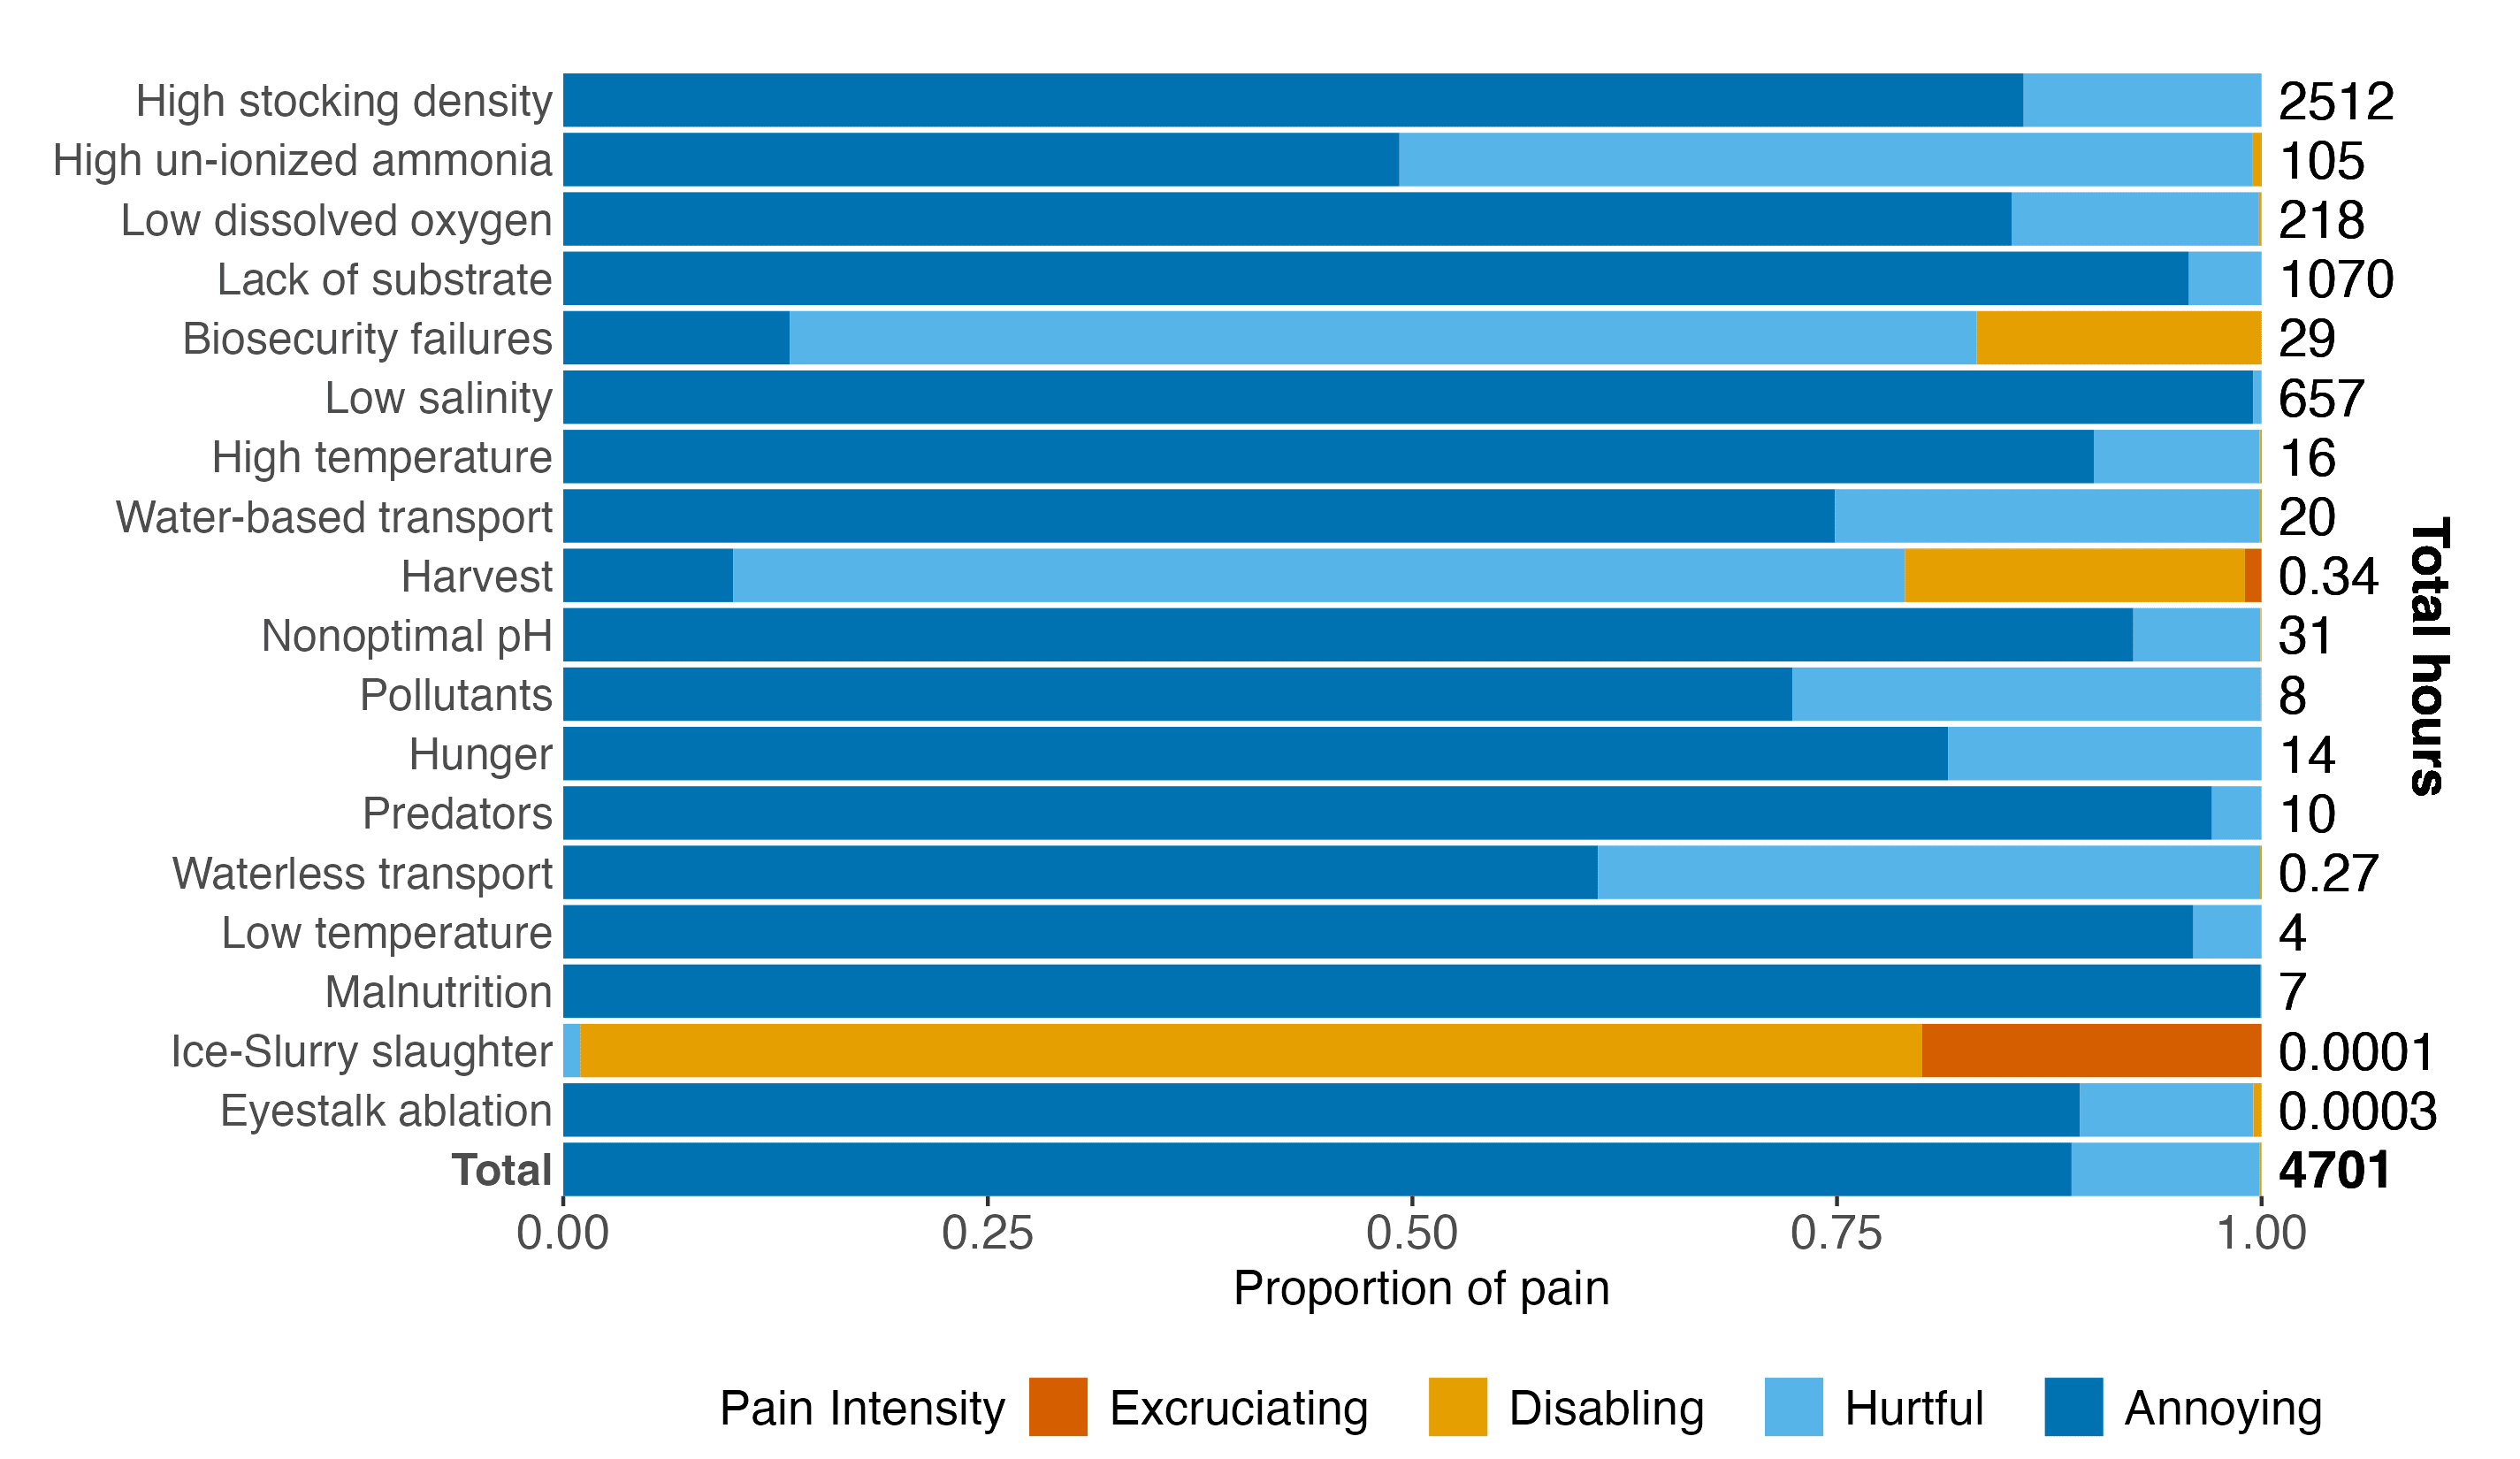
Disaggregating the results into the different pain intensities, the average shrimp experiences 4701 hours (95% SCI: [604, 8282]) of pain in total (Figure 3). The hours attributable to each pain category are:
- Annoying pain: 4174 hours, or 88.8% of the total hours
- Hurtful pain: 520 hours, or 11.1% of the total hours
- Disabling pain: 6 hours, or 0.13% of the total hours
- Excruciating pain: 0.13 hours, or 0.0028% of the total hours
Disabling and Excruciating pain are inconsistent with having positively valenced experiences, whereas Annoying and Hurtful pain do not preclude positive experiences (though, by definition, Hurtful pain reduces the capacity for positive experiences). This means that at least 6 hours, or 0.13%, of the total hours in pain reduces welfare for each shrimp.
Ranking Welfare Threats
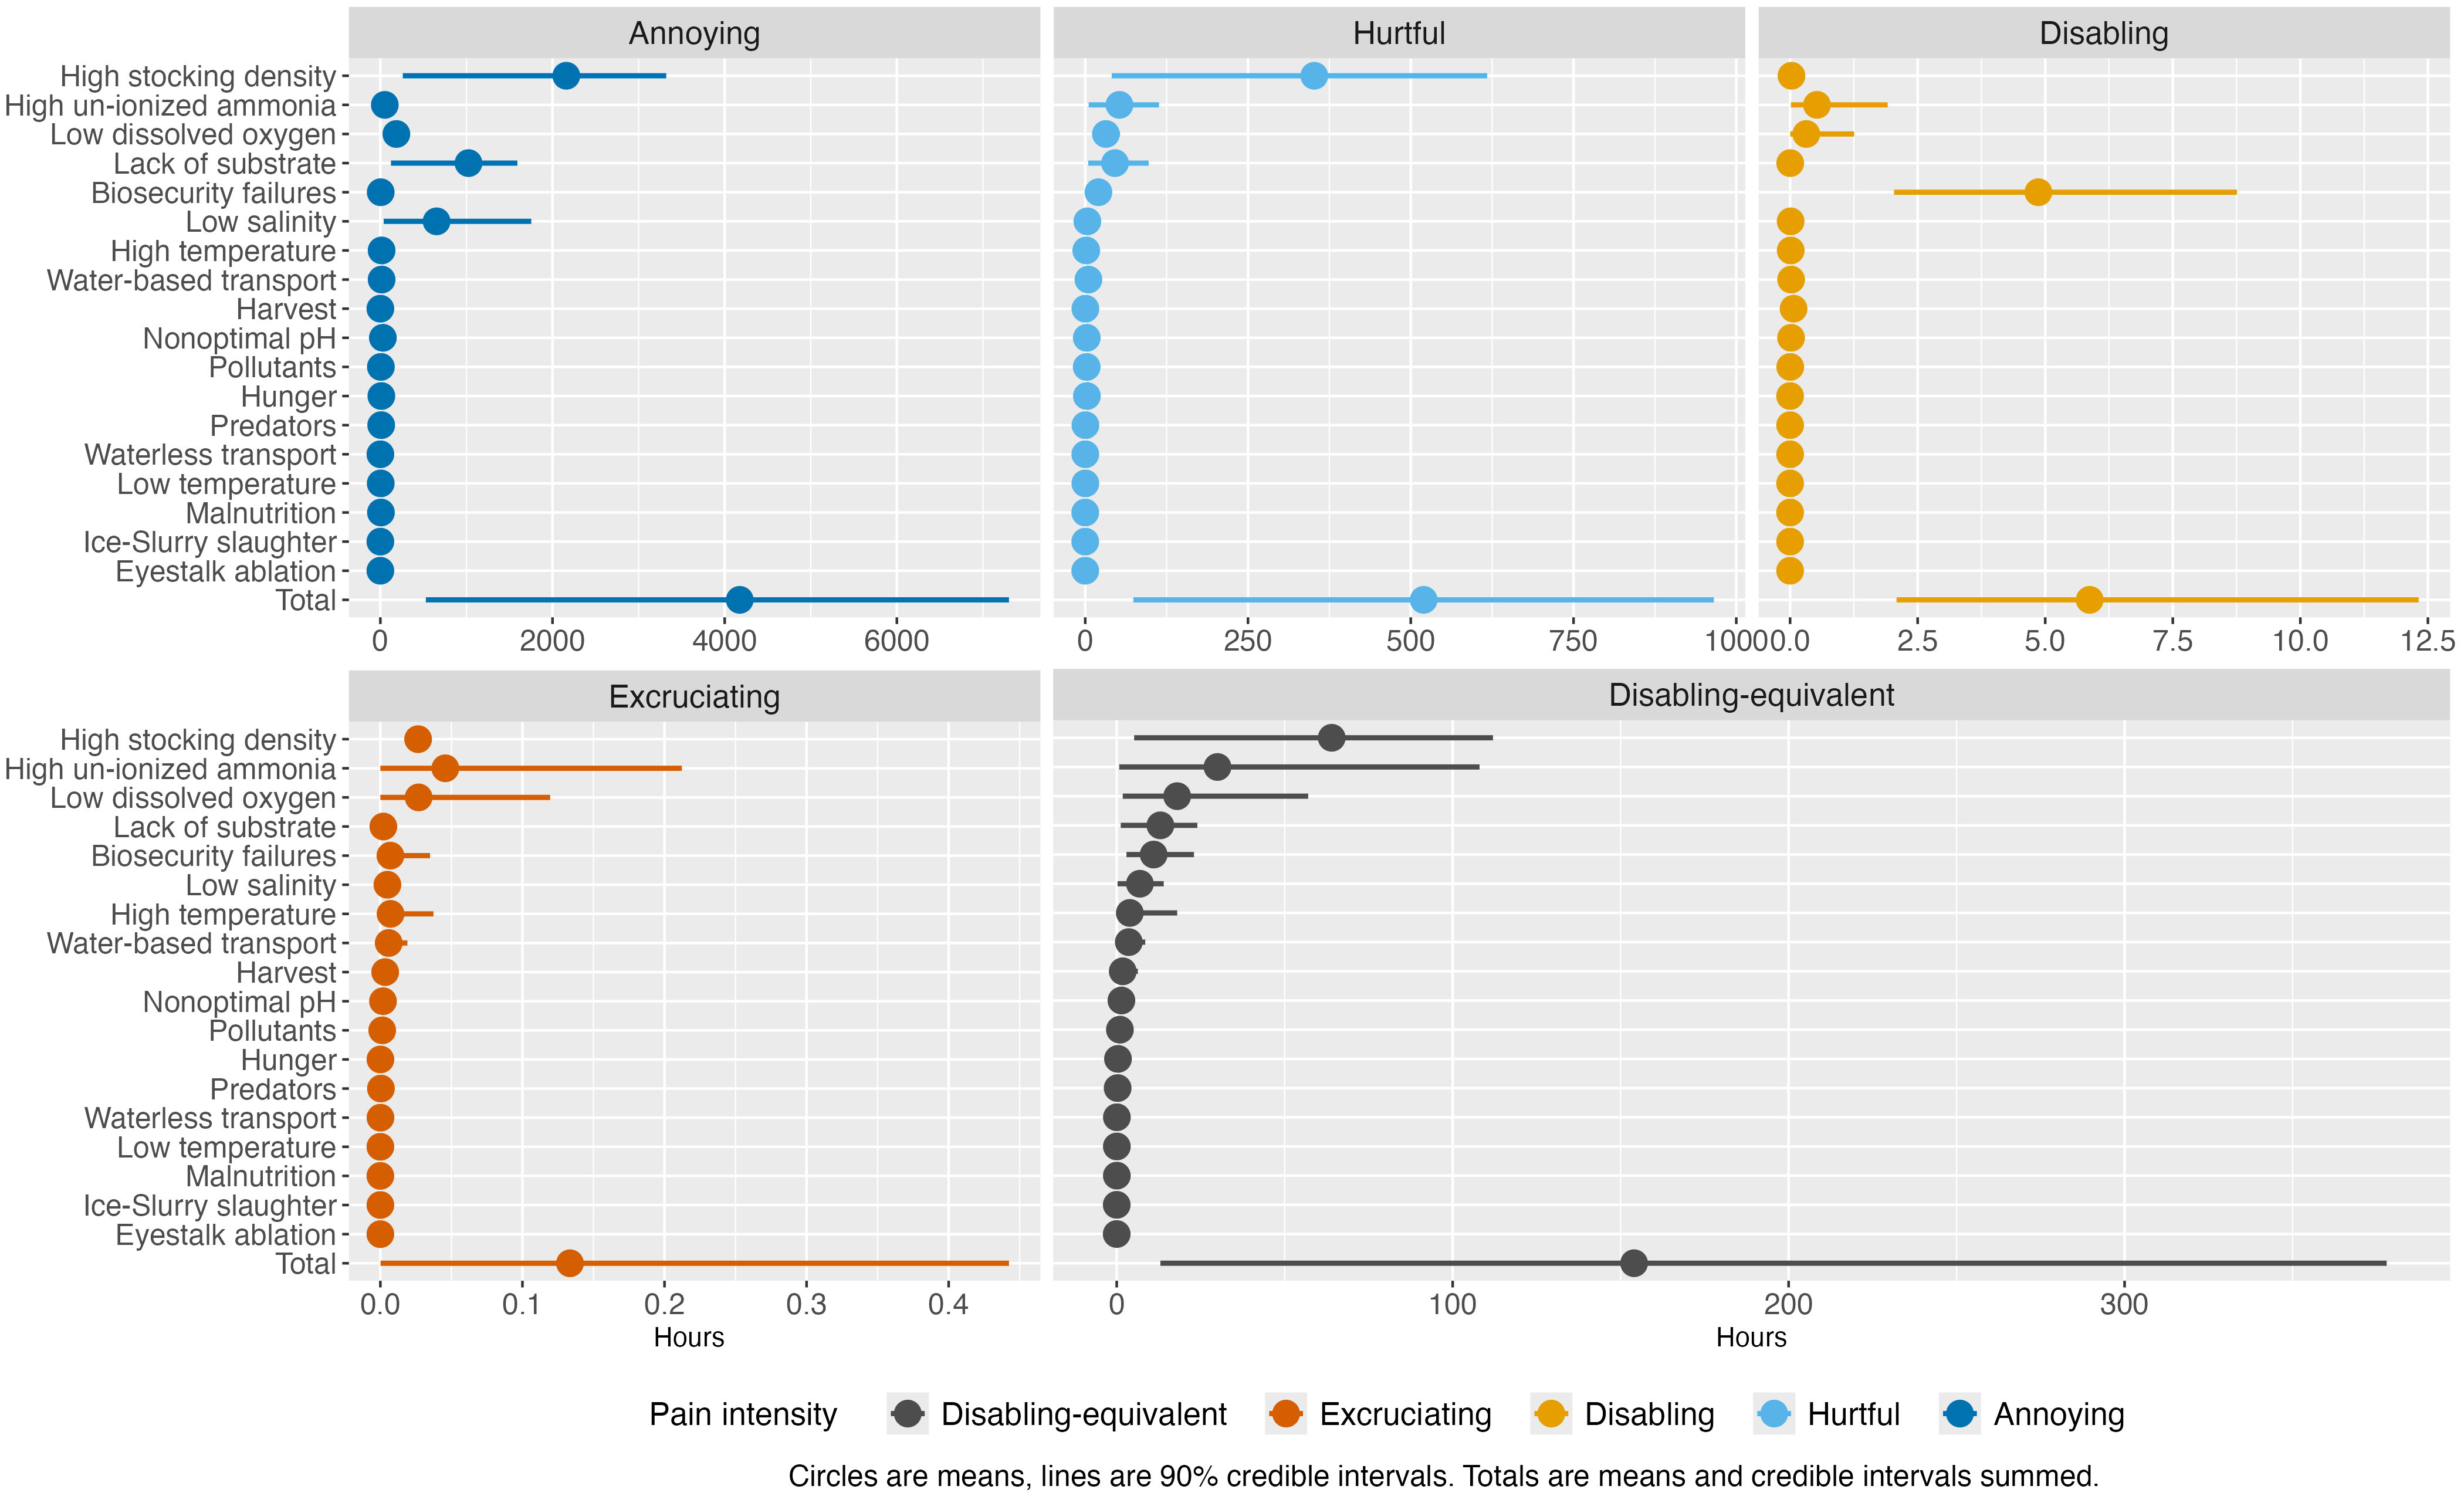
The highest-ranking welfare threats tend to be chronic, even if they are not always particularly severe. The top-ranking welfare threat is high stocking density, with 66 hours (95% SCI: [5.2, 112]) of Disabling-equivalent pain. The majority of this pain falls into the Annoying category. Stocking density ranked highly even though many of its negative effects are captured by other variables. This is because, by definition, high stocking densities occur on more intensive farms which have more shrimp. The same is true for lack of substrate.
Conversely, the lowest-ranking threats tend to be acute and only affect certain subpopulations, even if they are sometimes quite severe. This is true of eyestalk ablation, which only happens to broodstock, harvest (only those that don’t die pre-slaughter), and slaughter (only those that don’t die pre-slaughter or during harvest). These welfare threats are also short, which also reduces the disabling pain-equivalent hours. However, should pre-slaughter mortality rates decline in the future, more shrimp would be subjected to collection and slaughter, and the disabling pain-equivalent hours would also increase.
The rank order of the chronic vs. acute issues is fairly robust to uncertainty. Thus, even given our substantial uncertainty about weighting the severity categories, duration and prevalence appear to be more decisive factors.
Aside from the highest and lowest rankings, however, the rank order is not robust to uncertainty, limiting our ability to make fine-grained claims about which issues cause the most harm. Our parameters themselves could also be biased. For example, the high ranking of stocking density could be an artifact of benchmarking farms against wild shrimp densities. At 0.001m-2 to 4.9m-2, wild densities are lower even than some extensive farms. Using this reference class makes ‘high stocking densities’ an extremely prevalent issue. There are very few studies on wild shrimp (we found only two: Rivera-Velázquez et al., 2008; Medina-Reyna, 2001), so it is possible shrimp are sometimes found at higher densities or that there is seasonal variation. If these estimations of wild shrimp aggregation are incorrect, this would make our estimations of high stocking density prevalence far too high.
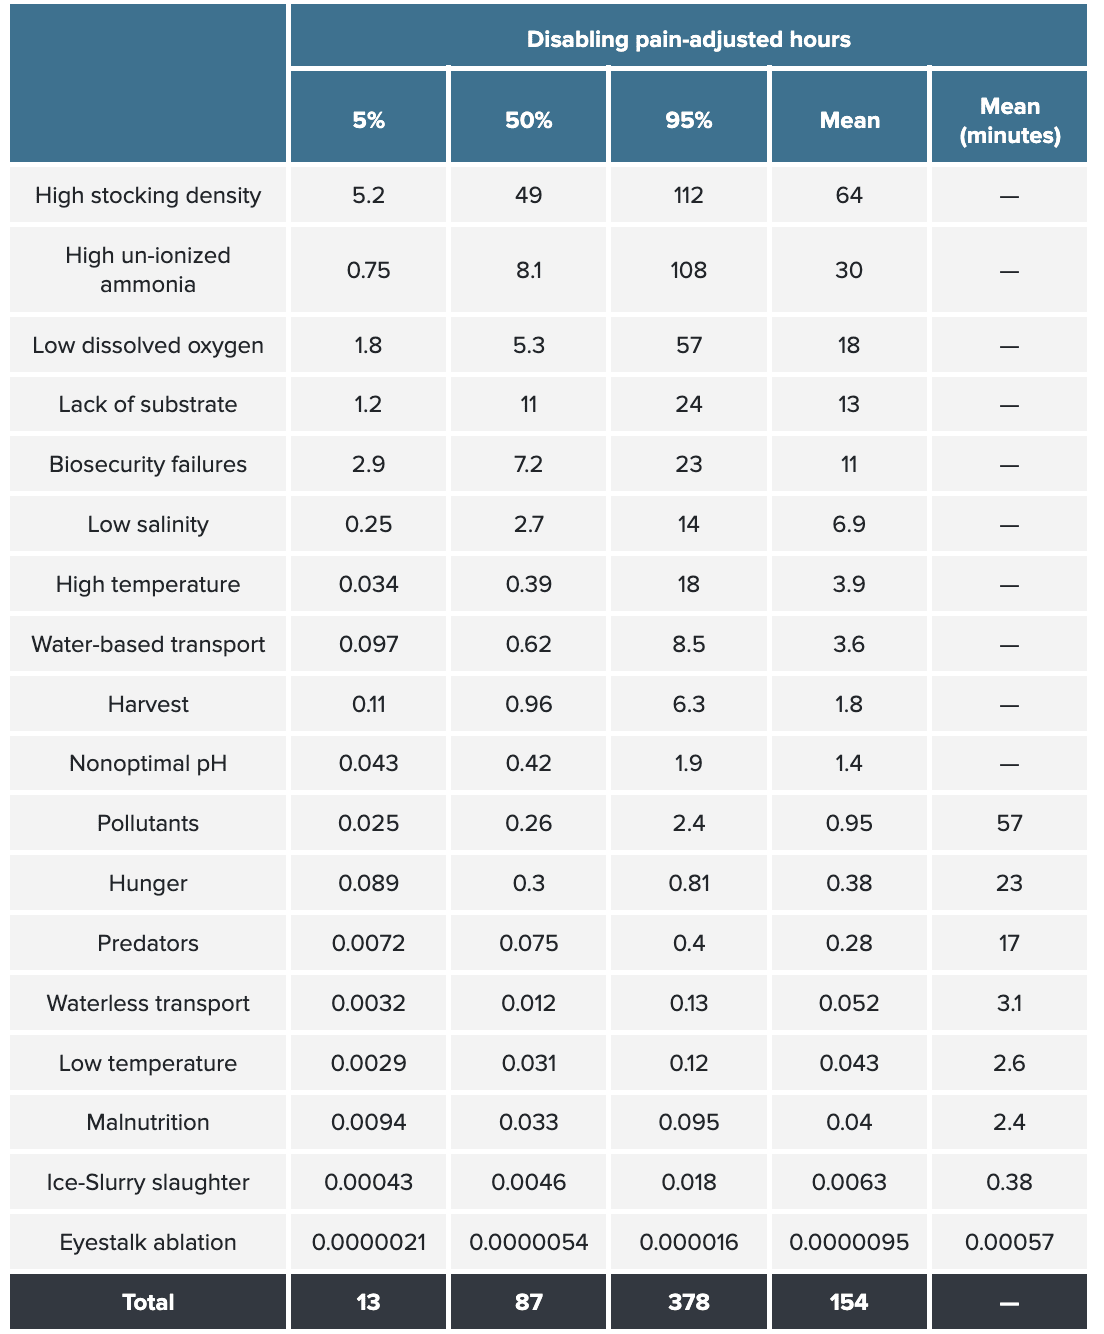
See Table 4 and Figure 4 for a full breakdown of the results.
Table 4: Estimates for the mean, 5%, 50%, and 95% quantiles for disabling pain-equivalent hours for each welfare issue.
Conclusion
Our model results suggest that shrimp aquaculture causes welfare issues of massive scope. In general, we have a lot of uncertainty around the prevalence of issues. Existing research on farming practices has several limitations, including non-random sampling (of farms, time, location in pond, and production stage), coarse measurements (e.g., ammonia instead of un-ionized ammonia), and underrepresentation of key demographics (e.g., intensive farms). High-quality surveys of farms would reduce our uncertainty about the prevalence of welfare issues and allow us to better prioritize where advocacy efforts should concentrate.
Despite all of this uncertainty, we can at least conclude that chronic, common issues cause more aggregate suffering than acute issues. All-else-equal, then, chronic issues should be targeted for improvement first.
But not all else is equal. How solvable or neglected an issue is also affects the expected value of working on that issue. Strategic considerations can also alter prioritization in ways that decontextualized expected value calculations would not. One could justify prioritizing less harmful issues for movement-building purposes—on this model, solving more tractable issues first makes less tractable issues more solvable. Additionally, improvements in some issues may be offset by increasing the prevalence of other issues. For example, solving water quality issues would allow for higher stocking densities. Current surveys tell us that the shrimp farming industry is heterogeneous, so there likely will not be a single welfare reform or intervention that can apply to the entire industry.
Finally, our findings are hindered by our understanding of pain (both in general and specific to shrimp). For example, if one holds the view that annoying-level pain (per the Welfare Footprint Project’s definition) is morally unimportant relative to more severe pain (e.g., Tomasik, 2016) then our results would be biased toward chronic welfare threats. Additionally, if shrimp experiencing annoying or hurtful pain are still capable of realizing positive welfare, then one may think their lives are still net-positive overall. Further research on the experiences of shrimp on farms is required to resolve these issues.
In the next report, we integrate strategic considerations with our estimates of how much suffering threats cause, to suggest some all-things-considered recommendations for interventions.
Acknowledgments
This report is a project of Rethink Priorities—a think tank dedicated to informing decisions made by high-impact organizations and funders across various cause areas. The authors are Hannah McKay and William McAuliffe. Thanks to Daniela R. Waldhorn for generating the initial idea and framework for the method used here. Thanks to Laura Duffy and Cynthia Schuck-Paim for helpful feedback on drafts of the report.
If you are interested in RP’s work, please visit our research database and subscribe to our newsletter.
Bibliography
The bibliography is available in the pdf version here.
Appendix
The appendix is available in the pdf version here.
- ^
From Waldhorn and Autric’s (2023) Guesstimate Model, the number of P. vannamei, P. monodon, and other penaeids who die on farms annually minus the number who die as larvae ([cell GZ - cell YM] + [cell ES - cell GJ] + [cell NN - cell JV]). For our estimate this was (620-97) + (56-14) + (65-22), but note that the model resamples each time it is opened so you may see different figures. The average number of female broodstock is ~2 million (see ‘Health’ in our separate methods document). Assuming a total of 4 million broodstock does not change the estimate when rounding to the nearest billion.